

The Stunning Ritz Carlton EVRIMA Yacht

Gliding Across Tokyo’s Sumida River: The Mesmerizing Zipper Boat

CROCUS Yacht: An 48 Meter Beauty by Admiral

PHI Yacht – Royal Huisman’s $45 Million Superyacht
- Zuretti Interior Design
- Zuretti Interior
- Zuccon International Project
- Ziyad al Manaseer
- Zaniz Interiors. Kutayba Alghanim
- Yuriy Kosiuk
- Yuri Milner
- Yersin Yacht

- Superyachts
RAGNAR Yacht – Immaculate $85M Superyacht
The RAGNAR yacht can be considered an expedition yacht with capabilities that go far beyond a traditional charter yacht.
Originally built as a multipurpose vessel with icebreaking capabilities, she was reconstructed entirely in 2020 and has been transformed into a luxury yacht that perfectly combines opulence with adventure.
Named after one of Nordic folklore’s most legendary heroes, RAGNAR could not have a more fitting name.
With a range of up to 6,000 nautical miles, she takes her guests to the most remote places on earth, including the far north and arctic.
However, a trip with RAGNAR does not have to be cold. The yacht can comfortably handle all weather conditions and has explored both glacial and tropical destinations in the past.

RAGNAR yacht interior
With eight guest cabins for up to twelve guests, the RAGNAR yacht is a spacious yacht even with a further 17 crew members on board.
She has two identical master suites kept in brown, dark blue, and golden tones creating a uniform design that can be found across the entire interior of the vessel.
State-of-the-art entertainment systems are only one telltale giveaway that RAGNAR was recently updated to provide its guests with the latest modern facilities.
The yacht is not only equipped with a full gym and a modern spa, including a Finnish sauna, but it also offers several separate lounges which provide privacy for guests and have some of the most breathtaking views imaginable.
It goes without saying that a stay aboard RAGNAR is a culinary experience like no other with five-star service and the full attention of an exceptional crew.
The bridge is the heart of this superyacht and, of course, is equipped with modern equipment needed to navigate even the roughest of seas.
State-of-the-art technology ensures a safe and comfortable journey to the world’s most adventurous places.

Toys And Equipment
Equipped with a plethora of toys, including three tenders, four jet skis, six seabobs as well as eFoils, a flyboard, scuba, and kitesurfing equipment, this yacht was made for adventure.
Guests can try their hand at watersports or simply enjoy themselves on one of the many decks, relaxing in the jacuzzi or pool.
The RAGNAR yacht also boasts a more than impressive helipad with an Airbus EC145 helicopter which can be requested if needed.
A three-person U-Boat Worx C-Explorer 3 submarine is another unusual toy that is available on this superyacht.
From these examples alone, it is apparent that RAGNAR is much more than a regular charter yacht.
A trip with her turns into an exhibition as she whisks her guests away to destinations that would be inaccessible with any other vessel.

RAGNAR was rebuilt entirely in 2020 after just eight years of sailing. Formerly a multipurpose vessel, she now impresses with her sleek design that the builders themselves describe as “ elegant, exclusive and exuberant ”.
Nothing about the RAGNAR yacht is accidental, and even the smallest detail seems carefully planned and thought out.
From the private terraces that extend from the twin master suites to the sophisticated and classically inspired interior that invites guests to relax and unwind after a long day of exploring.

Ragnar Yacht in Gibraltar
Do you have anything to add to this listing?
- Icon Yachts
- Royal Niestern Sander
Love Yachts? Join us.
Related posts.

ADASTRA Yacht – Exquisite Craftsmanship $10M Superyacht

SARAH Yacht – High-end $60 M Superyacht

QUANTUM OF SOLACE Yacht – Majestic $58 Million Superyacht

GENE MACHINE Yacht – Impressive $35M Superyacht

Find anything, super fast.
- Destinations
- Documentaries
We don't have any additional photos of this yacht. Do you?
Motor Yacht
Ragnar is a custom motor yacht launched in 2012 by Royal Niestern Sander, in the Netherlands and most recently refitted in 2020.
Ragnar measures 68.2 metres in length and has a beam of 14.3 feet.
Ragnar also features naval architecture by Royal Niestern Sander.
Performance and Capabilities
Ragnar has a top speed of 12.00 knots. .
Accommodation
Ragnar accommodates up to 16 guests in 8 cabins.
Other Specifications
Ragnar flies the flag of Maltese.
She is also fitted with a jacuzzi (on deck), helicopter landing pad and beauty salon.
- Yacht Builder Royal Niestern Sander No profile available
- Naval Architect Royal Niestern Sander No profile available
- Exterior Designer RWD No profile available
- Interior Designer RWD No profile available
Yacht Specs
Related news.
RAGNAR MCP Yachts
- Inspiration
RAGNAR has 36 Photos

RAGNAR News

Revealed: The awe-inspiring 2021-2023 ...
Similar yachts.

ULTIMATE LADY | From US$ 59,000/wk
- Yachts >
- All Yachts >
- All Motor Yachts 50ft/15m - 100ft/30m >
If you have any questions about the RAGNAR information page below please contact us .
Built in 2018, 27.7m/90.9ft luxury yacht RAGNAR is the first of the 925 THD series from Brazilian shipyard MCP Yachts. The naval architecture and exterior styling is the work of the shipyard, who also worked in collaboration with Andreia Guiraldella and Lia Siqueira to complete the interiors. The accommodation sleeps up to 12 guests over six en-suite cabins, with a crew of four to provide expert service.
NOTABLE FEATURES OF RAGNAR: ~Contemporary interior styling ~Fold-down balcony off formal dining area ~Spacious flybridge alfresco dining and living area ~Navigates shallow waterways with draft of 1.9m/6ft ~Range of 3,000 nautical miles ~Air conditioning ~Wi-Fi
The lower deck swim platform has plenty of room for sunbathing or spreading out with the water toys, and after a swim guests can rest on the sofa integrated into the main deck aft and enjoy an alfresco meal at the raised dining table.
There are two main sunbathing areas on board: The bow in front of the raised pilothouse is covered with two large sunbeds and up on the flybridge sun chairs around a coffee table create a casual space along the aft to enjoy the views. The flybridge amidships is shaded by a hardtop, and underneath the layout offers a port wet bar with one sofa to port, a C-shaped sofa and two dining tables opposite and a wet bar behind. The helm station controls are placed forward to port and a staircase centre leads down to the interior pilothouse.
The lower deck hosts the guest and crew accommodation, placing the guest cabins forward and amidships followed by the engine room with the crew accommodation in the stern.
RAGNAR Specifications
On the main deck, a corridor leads from the main foyer through to the forward Master suite which takes advantage of its position for greater space and increased natural light. The galley port of the foyer leads through to the formal dining area, which seats 10 guests and enjoys fresh air and maritime ambience with the glass sliding doors and fold-down balcony to starboard. The aft lounge is separated from the main salon by a dividing cabinet with a widescreen TV, and on each side of the lounge, there is a plush sofa with the addition of a coffee table and armchair to port.
A pair of Caterpillar 1,925 HP engines provides a maximum of 27 knots and a cruising speed of 23 knots with a range of 3,000 nautical miles.
Yacht Accommodation
The accommodation sleeps a maximum of 12 guests over 6 en-suite cabins: 1 Master suite, 3 double cabins and 2 twin cabins. The Master suite is placed forward on the main deck and contains a king-sized bed with a desk to port and excellent views out of the starboard windows. The forward en-suite bathroom is on a split level to the bedroom and has his-and-hers sinks as well as a toilet and a large shower. The lower deck places one of the double cabins in the bow and the forward en-suite bathroom contains a sink and shower with separate toilet.
Amenities and Extras
We do have available further amenity, owner and price information for the 27.74 m (91'01'') yacht RAGNAR, so please enquire for more information.
RAGNAR Disclaimer:
The luxury yacht RAGNAR displayed on this page is merely informational and she is not necessarily available for yacht charter or for sale, nor is she represented or marketed in anyway by CharterWorld. This web page and the superyacht information contained herein is not contractual. All yacht specifications and informations are displayed in good faith but CharterWorld does not warrant or assume any legal liability or responsibility for the current accuracy, completeness, validity, or usefulness of any superyacht information and/or images displayed. All boat information is subject to change without prior notice and may not be current.
Quick Enquiry

Sunseeker 90 Dreamster | From EUR€ 40,000/wk

ASHA | From EUR€ 45,000/wk

IMPERATORE | From EUR€ 55,000/wk

The global authority in superyachting
- NEWSLETTERS
- Yachts Home
- The Superyacht Directory
- Yacht Reports
- Brokerage News
- The largest yachts in the world
- The Register
- Yacht Advice
- Yacht Design
- 12m to 24m yachts
- Monaco Yacht Show
- Builder Directory
- Designer Directory
- Interior Design Directory
- Naval Architect Directory
- Yachts for sale home
- Motor yachts
- Sailing yachts
- Explorer yachts
- Classic yachts
- Sale Broker Directory
- Charter Home
- Yachts for Charter
- Charter Destinations
- Charter Broker Directory
- Destinations Home
- Mediterranean
- South Pacific
- Rest of the World
- Boat Life Home
- Owners' Experiences
- Interiors Suppliers
- Owners' Club
- Captains' Club
- BOAT Showcase
- Boat Presents
- Events Home
- World Superyacht Awards
- Superyacht Design Festival
- Design and Innovation Awards
- Young Designer of the Year Award
- Artistry and Craft Awards
- Explorer Yachts Summit
- Ocean Talks
- The Ocean Awards
- BOAT Connect
- Between the bays
- Golf Invitational
- Boat Pro Home
- Pricing Plan
- Superyacht Insight
- Product Features
- Premium Content
- Testimonials
- Global Order Book
- Tenders & Equipment

68m Viking-inspired expedition yacht Ragnar sold
The 68.2-metre Icon explorer yacht Ragnar has been sold by Konstantin Kolpakov of Arcon Yachts with Frank Grzeszczak Sr. of FGI Yacht Group representing the buyer.
Originally built as an ice-breaking multipurpose supply vessel in 2012, Ragnar was transformed into a world-girdling expedition yacht by Icon Yachts in Holland to a design by RWD and delivered in 2020. Her exterior is said to have been inspired by a medieval Viking helmet, while her interior takes cues from cosy ski chalets, Scottish castles and classic British pubs.
Most like a conventional yacht is the top deck, a sheltered but open-air space with a spa pool, bar, barbecue and seating area. Stairs on either side – one for crew and the other for guests – lead to the "A" deck, which is divided between the large wheelhouse and a panoramic upper saloon with space for outdoor dining.
The upper saloon features tartan fabrics, Chesterfield seats, dark-stained walnut walls and chevron parquet floors for a cosy pub-like feel. The main saloon features a British pub-style bar and wine cellar, and the dining room is complete with a full-size likeness of the Viking warrior Ragnar, after which the boat was named.
She can accommodate 12 guests and 17 crew on board and features two identical owner’s cabins on the "B" deck, both of which are connected to a private terrace and the forward observation lounge for enjoying the views. The guest cabins on the main deck are finished with bleached oak and light, neutral colours for a good night’s sleep.
Other highlights include a spa with plenty of warm travertine and teak to warm up after a ski expedition or an ice-cold shower.
She is equipped with electrically driven Wärtsilä Icepod thrusters, while the diesel-electric Caterpillar propulsion uses electric pod drives for a cruising speed of 12.5 knots topping out at 14 knots at half load, as well as a range of 6,000 nautical miles. A certified helideck can handle an Airbus EC145 helicopter and an industrial crane extends several metres and supports a load of up to 10 tonnes.
Ragnar was asking €69,500,000.
More about this yacht
More stories, most popular, from our partners, sponsored listings.
Yacht Charter
Description.
RAGNAR is more than a charter yacht. RAGNAR is a powerful portal into a world of adventure and excitement, an ice breaking vortex that transports the brave and the bold into a world of bears and orca, of midnight fire in the sky and glistening, untouched pistes of snow and ice. RAGNAR grants the willing the ability to fly with eagles, to dive with whales, to carve through the waves with the power of 800 horses and to race across snowy valleys at the twist of a wrist. With a commercially certified helipad and a 5000L refuelling capacity and dedicated storage and changing facilities for heli-skiing (Ski Racks, board racks and boot warmers). You will luxuriate in the top deck jacuzzi and the C deck pool forward of the fully certified helipad, test your strength in the large, fully equipped gym, dine on the pool deck or inside under the awesome gaze of a figure of RAGNAR himself, then contemplate the majesty of high latitudes from the B deck observation lounge.
Tender & Toys
Tenders: 8.2m Ribeye tender with 400hp 7.4m Ribeye tender with 250hp 4.5m Zodiac with 40hp Toys: 4 x Seadoo RXT-X 300 jetskis 4 x Snow Mobiles (Lynx Alpine Ranger) 6 x Seabobs 2 x Lift eFoils (Hydrofoil boards) 8 x Diving equipment Wakeboards, waterskis & tows 1 x Flyboard 4 x Adult paddleboards 2 x Children’s paddleboards 2 x Surfboards 2 x Kite surfing equipment 5 x Windsurfing Rigs Fishing gear Diving equipment: 10 x Aqualung Pro HD BCDs 10 x Aqualung core din valve regulators 15 x steel 12L tanks Mares boot fins all sizes Mares no boot fins all sizes Mares x vision masks and snorkels Full face snorkel masks SMBs Full oxygen kit for tender Dive torches and knives Go Pro Black 9 underwater cameras Smaller accessories and everything required to operate remotely: 1 x dive instructor 2 x divemasters 1 x underwater videographer Made to measure floating beach club including 10 x 7m pool with removable jellyfish net and sea stairs. 1 x BigBo ATV that can only operate within the mandatory safety operational parameters. Dedicated storage and changing facilities for heli-skiing (Ski Racks, board racks and boot warmers). Equipment supplied by the heli-ski company assigned to run the programme. Approved RYA training centre for personal watercraft.
Gym equipment: Spacious fully equipped state of the art gym: Treadmill Elliptical trainer Technogym Weights and bench
Characteristics
Fully certified Helipad
Range of 6,000 nautical miles to explore the most remote areas of the planet
LY3 classed with Arctic Explorer capabilities
Spa facilities: a massage room, sauna, steam room & more
A fully equipped gym
Jacuzzis on top deck and main deck
Full ice breaking functionality with a surplus of power designed for extreme weather conditions
Dedicated spa with massage room, sauna, steam room, ice bowl & cold bucket.
State-of-the-art AV systems Apple TV Video games centre in main saloon and library Wi-Fi internet access VSAT Satellite television (where geographically available)
Accommodation
12 guests (6 double, 1 twin (staff) and 1 single (staff) with pullman) Main deck 4 x double cabins each with walk-in wardrobe and shower room en suite 1 x twin cabin with shower room en suite (staff) 1 x office/single convertible (single bed and pullman) with shower room en suite (staff) B-deck 2 x aft-facing master suites with an interconnecting door that can convert owner’s suites to one large suite. Both master suites with walk-in wardrobes and bathrooms en suite

Icon Ragnar yacht project
Overall information
PDF brochure
Project Ragnar is a large-scale conversion project of 62.8-meter icebreaker Sanaborg into a luxury explorer. All the works of two-year project were carried out under the technical control of Arcon Yachts at the Dutch shipyard ICON Yachts, which also made a refit of the famous explorer Legend, as well converted from a support vessel. The initial icebreaker itself was also originally built in Holland at the Royal Niestern Sander shipyard and launched in 2012.
After the refit and modernization, the Ragnar project turned into a 62.8-meter research mega-yacht with an internal volume of 2.450 GT, which is fully prepared for long autonomous trips in any latitude of the world, including the Arctic. Moreover, the unique Ragnar can still be an icebreaker and is certified as Ice Class A1 yacht.
The hull of the brutal vessel is made of steel, the external and internal design is developed by the English bureau RWD (Redman Whiteley Dixon). There are impressive technical features onboard: the PC5 hybrid engine system, which provides a range of up to 6,000 nautical miles and a maximum speed of 14 knots. Due to the draft of only 3.15 m the yacht will have access to the most remote corners of the planet and wild shallow beaches. The inside areas of the yacht will be incredibly spacious, and the interiors will be designed in a classic Victorian style with elements of Medieval warship theme, with finishing of Mahogany and light walnut.
Ragnar comfortably accommodates 12 guests, with 2 master suites, 4 double cabins and 1 twin cabin. The Owner and guests of the “Arctic Explorer” also have all the attributes of a classic mega yacht at their disposal: SPA salon with massage rooms, sauna, two swimming pools, one of them with ice water, snow room, jacuzzi, full-size gym with all the equipment. Comfort, top level service and safety on board will be provided by 17 crew members.
The whole arsenal of additional equipment and toys is provided for long exotic journeys: submarine, Ripsaw EV2 snow all-terrain vehicle, Eurocopter EC145 with a fully certified helipad, two 8 m long tenders, two laser class sailing boats, two 6 m RIB tenders, two jet skis, additional “floating beach” platform and much more.
The launch of Ragnar is planned for summer season 2020, and the yacht will be immediately available for charters in Iceland and Greenland. Super explorer is going to be available also this summer season in Mediterranean and later in the Caribbean.
Make an enquiry
Executed work: All-inclusive project management of the yacht
- Yachts for sale
- Yachts for charter
- Brokerage News

- Yacht Harbour
Contact agent

Specifications
Similar yachts.

New listings


Explorer Yacht Ragnar
Major conversion of the ice breaking multipurpose support vessel Sanaborg to an one of a kind luxurious explorer yacht.
Vessel name: Ragnar
Shipyard (conversion): Icon Yachts
Design Philosophy Ragnar
In 2017 our Research and Consultancy department was assigned with the conversion design study for the ice breaking multipurpose support vessel Sanaborg (also originally designed by Conoship International) to the unique explorer superyacht “Ragnar”. Based on the owners and Icon Yachts’ wishes and demands we provided a technical general arrangement plan together with a positive advice for the technical feasibility of this conversion.
During the conversion stage we provided the complete naval architecture and detailed construction design and engineering of the new superstructure of the vessel, based on the current rules and regulations by Class (Polar code 5 and Large yacht code 3). Resulting in an ultimate adventure experience explorer superyacht, delivered with unsurpassed style and luxury, fully compliant within the applicable rules and regulations by Class. Ragnar was launched at the ICON Yachts shipyard in January 2020.
Watch Ragnar on our YouTube channel

Read more about the original vessel
Images & video courtesy of Icon Yachts Photo (header) courtesy of Guy Fleury
This might also interest you
Conoship is exhibiting at breakbulk europe 2024, spotlight on northern dutch shipbuilding: insights from the maritime manufacturing meeting, presentation of conoship’s report by the ministry of infrastructure and water management on the safety of beam trawlers.

- Privacy Overview
- Strictly Necessary Cookies
- 3rd Party Cookies
This website uses cookies so that we can provide you with the best user experience possible. Cookie information is stored in your browser and performs functions such as recognising you when you return to our website and helping our team to understand which sections of the website you find most interesting and useful.
Strictly Necessary Cookie should be enabled at all times so that we can save your preferences for cookie settings.
If you disable this cookie, we will not be able to save your preferences. This means that every time you visit this website you will need to enable or disable cookies again.
This website uses Google Analytics to collect anonymous information such as the number of visitors to the site, and the most popular pages.
Keeping this cookie enabled helps us to improve our website.
Please enable Strictly Necessary Cookies first so that we can save your preferences!
Please use a modern browser to view this website. Some elements might not work as expected when using Internet Explorer.
- Landing Page
- Luxury Yacht Vacation Types
- Corporate Yacht Charter
- Tailor Made Vacations
- Luxury Exploration Vacations
- View All 3600
- Motor Yachts
- Sailing Yachts
- Classic Yachts
- Catamaran Yachts
- Filter By Destination
- More Filters
- Latest Reviews
- Charter Special Offers
- Destination Guides
- Inspiration & Features
- Mediterranean Charter Yachts
- France Charter Yachts
- Italy Charter Yachts
- Croatia Charter Yachts
- Greece Charter Yachts
- Turkey Charter Yachts
- Bahamas Charter Yachts
- Caribbean Charter Yachts
- Australia Charter Yachts
- Thailand Charter Yachts
- Dubai Charter Yachts
- Destination News
- New To Fleet
- Charter Fleet Updates
- Special Offers
- Industry News
- Yacht Shows
- Corporate Charter
- Finding a Yacht Broker
- Charter Preferences
- Questions & Answers
- Add my yacht

View More Photos
- Luxury Charter Yachts
- Motor Yachts for Charter
- Amenities & Toys
- Rates & Regions
- + Shortlist
Q YACHT CHARTER
68.2m / 223'9 royal niestern sander 2012 / 2020.
- Previous Yacht
Cabin Configuration
Special Features:
- Sumptuous spa center, complete with massage room, sauna, foot spa and steam room
- Top deck Jacuzzi
- Three-person submarine
- Airbus EC145 helicopter for heliskiing adventures
- Majestic array of water toys and tenders
- Splendid observation lounge
With a range of 6,000nm, Q is ideal for the adventurous at heart
The 68.2m/223'9" expedition yacht 'Q' by shipyard Royal Niestern Sander offers flexible accommodation for up to 12 guests in 8 cabins and features interior styling by British designer RWD. She originally served as an ice breaking multipurpose support supply vessel before being converted into a yacht by Icon Yachts in 2020.
Built in 2012, Q is made for thrilling adventure and exploration in the most remote places around the globe. Her features include a helipad, spa and gym.
Guest Accommodation
Q offers guest accommodation for up to 12 guests in 8 suites comprising a master suite, four double cabins and one twin cabin. There are 9 beds in total, including 2 king, 4 queen and 2 singles. She is also capable of carrying up to 13 crew onboard to ensure a relaxed luxury yacht charter experience.
Onboard Comfort & Entertainment
On your charter, you'll find plenty to keep you busy and entertained such as a steam room, all you need to relax muscles and reduce stress. Take the opportunity to be thoroughly pampered and indulged in the spa plus guests can enjoy a dip in the pool. Maintain your fitness routine and work out in the well-equipped gym or elsewhere, sit back with a glass of champagne in the deck jacuzzi.
Whatever your activities on your charter, you'll find some impressive features are seamlessly integrated to help you such as a helipad, allowing seamless travel to and from land. With Wi-Fi connectivity you don't have to lose contact with the outside world, unless you want to plus you can stay comfortable on board whatever the weather, with air conditioning during your charter.
Performance & Range
Built with a steel hull and steel superstructure, she offers greater on-board space and is more stable when at anchor thanks to her full-displacement hull. Powered by twin Caterpillar engines, she comfortably cruises at 12 knots, reaches a maximum speed of 14 knots with a range of up to 6,000 nautical miles from her 817,000 litre fuel tanks. An advanced stabilisation system on board reduces the side-to-side roll of the yacht and promises guests exceptional comfort levels at anchor or when underway.
Onboard Q has a range of toys and accessories to keep you and your guests entertained on the water throughout your stay. Principle among these is a U-Boat Worx C-Explorer 3 submarine allowing you to discover the magical world beneath the waves, a submarine experience will be the most awe-inspiring adventure you could imagine. Take to the sea on the Jet Skis offering you power and control on the water. Q features two tenders, but leading the pack is a 8.9m/29'2" Marell Tender to transport you in style.
Q offers you and your guests the perfect platform from which to enjoy your next luxury yacht charter. Please enquire for details of her winter and forthcoming summer cruising grounds and availability.
With a highly experienced and talented crew of 13, you can be sure that each and every need will be met and exceeded while on board this prestigious expedition yacht.
TESTIMONIALS
There are currently no testimonials for Q, please provide .

Amenities & Entertainment
For your relaxation and entertainment Q has the following facilities, for more details please speak to your yacht charter broker.
Q is reported to be available to Charter with the following recreation facilities:
- 4 x Snow mobile
- Ski and heli-skiing equipment
- 1 x 8.9m / 29'2 Marell 900cc Tender with 2 x 400 HP engines
- 2 x 7.5m / 24'7 Castoldi Jet Tender with 1 x 250 HP engine
For a full list of all available amenities & entertainment facilities, or price to hire additional equipment please contact your broker.
- + shortlist
For a full list of all available amenities & entertainment facilities, or price to hire additional equipment please contact your broker.
'Q' Charter Rates & Destinations
Summer Season
May - September
€525,000 p/week + expenses Approx $561,000
High Season
Cruising Regions
Please enquire .
Winter Season
October - April
$525,000 p/week + expenses
To charter this luxury yacht contact your charter broker , or we can help you.
To charter this luxury yacht contact your charter broker or
Update your yacht
Yacht Owner, Captain or Central Agents - Send us latest Photos, Charter Rates or Corrections Send Updates
SIMILAR YACHTS FOR CHARTER

60m | Brooke Marine
from $314,000 p/week

69m | Svendborg Skibsvaerft
from $128,000 p/week ♦︎

Bleu De Nimes
72m | Clelands Shipbuilding Co
from $523,000 p/week ♦︎

62m | J.J. Sietas
POA ♦︎

56m | Turquoise Yachts
from $294,000 p/week

67m | Benetti
from $680,000 p/week

75m | Abeking & Rasmussen
from $801,000 p/week ♦︎

Come Together
60m | Amels
from $450,000 p/week

71m | Richards Shipbuilders
from $310,000 p/week ♦︎

71m | Royal Denship
from $384,000 p/week ♦︎

56m | Picchiotti
from $299,000 p/week ♦︎

67m | Shadow Marine
from $120,000 p/week
NOTE to U.S. Customs & Border Protection
Specification
SEASONAL CHARTER RATES
- Share on Facebook
- Share Yacht
SIMILAR LUXURY CHARTER YACHTS
Here are a selection of yachts which are similar to the current charter yacht. To view all similar luxury charter yachts click on the button below.

As Featured In
The YachtCharterFleet Difference
YachtCharterFleet makes it easy to find the yacht charter vacation that is right for you. We combine thousands of yacht listings with local destination information, sample itineraries and experiences to deliver the world's most comprehensive yacht charter website.
San Francisco
- Like us on Facebook
- Follow us on Twitter
- Follow us on Instagram
- Find us on LinkedIn
- Add My Yacht
- Affiliates & Partners
Popular Destinations & Events
- St Tropez Yacht Charter
- Monaco Yacht Charter
- St Barts Yacht Charter
- Greece Yacht Charter
- Mykonos Yacht Charter
- Caribbean Yacht Charter
Featured Charter Yachts
- Maltese Falcon Yacht Charter
- Wheels Yacht Charter
- Victorious Yacht Charter
- Andrea Yacht Charter
- Titania Yacht Charter
- Ahpo Yacht Charter
Receive our latest offers, trends and stories direct to your inbox.
Please enter a valid e-mail.
Thanks for subscribing.
Search for Yachts, Destinations, Events, News... everything related to Luxury Yachts for Charter.
Yachts in your shortlist
hypothesis testing in statistics python

Statistics Made Easy
How to Perform Hypothesis Testing in Python (With Examples)
A hypothesis test is a formal statistical test we use to reject or fail to reject some statistical hypothesis.
This tutorial explains how to perform the following hypothesis tests in Python:
- One sample t-test
- Two sample t-test
- Paired samples t-test
Let’s jump in!
Example 1: One Sample t-test in Python
A one sample t-test is used to test whether or not the mean of a population is equal to some value.
For example, suppose we want to know whether or not the mean weight of a certain species of some turtle is equal to 310 pounds.
To test this, we go out and collect a simple random sample of turtles with the following weights:
Weights : 300, 315, 320, 311, 314, 309, 300, 308, 305, 303, 305, 301, 303
The following code shows how to use the ttest_1samp() function from the scipy.stats library to perform a one sample t-test:
The t test statistic is -1.5848 and the corresponding two-sided p-value is 0.1389 .
The two hypotheses for this particular one sample t-test are as follows:
- H 0 : µ = 310 (the mean weight for this species of turtle is 310 pounds)
- H A : µ ≠310 (the mean weight is not 310 pounds)
Because the p-value of our test (0.1389) is greater than alpha = 0.05, we fail to reject the null hypothesis of the test.
We do not have sufficient evidence to say that the mean weight for this particular species of turtle is different from 310 pounds.
Example 2: Two Sample t-test in Python
A two sample t-test is used to test whether or not the means of two populations are equal.
For example, suppose we want to know whether or not the mean weight between two different species of turtles is equal.
To test this, we collect a simple random sample of turtles from each species with the following weights:
Sample 1 : 300, 315, 320, 311, 314, 309, 300, 308, 305, 303, 305, 301, 303
Sample 2 : 335, 329, 322, 321, 324, 319, 304, 308, 305, 311, 307, 300, 305
The following code shows how to use the ttest_ind() function from the scipy.stats library to perform this two sample t-test:
The t test statistic is – 2.1009 and the corresponding two-sided p-value is 0.0463 .
The two hypotheses for this particular two sample t-test are as follows:
- H 0 : µ 1 = µ 2 (the mean weight between the two species is equal)
- H A : µ 1 ≠ µ 2 (the mean weight between the two species is not equal)
Since the p-value of the test (0.0463) is less than .05, we reject the null hypothesis.
This means we have sufficient evidence to say that the mean weight between the two species is not equal.
Example 3: Paired Samples t-test in Python
A paired samples t-test is used to compare the means of two samples when each observation in one sample can be paired with an observation in the other sample.
For example, suppose we want to know whether or not a certain training program is able to increase the max vertical jump (in inches) of basketball players.
To test this, we may recruit a simple random sample of 12 college basketball players and measure each of their max vertical jumps. Then, we may have each player use the training program for one month and then measure their max vertical jump again at the end of the month.
The following data shows the max jump height (in inches) before and after using the training program for each player:
Before : 22, 24, 20, 19, 19, 20, 22, 25, 24, 23, 22, 21
After : 23, 25, 20, 24, 18, 22, 23, 28, 24, 25, 24, 20
The following code shows how to use the ttest_rel() function from the scipy.stats library to perform this paired samples t-test:
The t test statistic is – 2.5289 and the corresponding two-sided p-value is 0.0280 .
The two hypotheses for this particular paired samples t-test are as follows:
- H 0 : µ 1 = µ 2 (the mean jump height before and after using the program is equal)
- H A : µ 1 ≠ µ 2 (the mean jump height before and after using the program is not equal)
Since the p-value of the test (0.0280) is less than .05, we reject the null hypothesis.
This means we have sufficient evidence to say that the mean jump height before and after using the training program is not equal.
Additional Resources
You can use the following online calculators to automatically perform various t-tests:
One Sample t-test Calculator Two Sample t-test Calculator Paired Samples t-test Calculator
Published by Zach
Leave a reply cancel reply.
Your email address will not be published. Required fields are marked *

Your Data Guide

How to Perform Hypothesis Testing Using Python

Step into the intriguing world of hypothesis testing, where your natural curiosity meets the power of data to reveal truths!
This article is your key to unlocking how those everyday hunches—like guessing a group’s average income or figuring out who owns their home—can be thoroughly checked and proven with data.
Thanks for reading Your Data Guide! Subscribe for free to receive new posts and support my work.
I am going to take you by the hand and show you, in simple steps, how to use Python to explore a hypothesis about the average yearly income.
By the time we’re done, you’ll not only get the hang of creating and testing hypotheses but also how to use statistical tests on actual data.
Perfect for up-and-coming data scientists, anyone with a knack for analysis, or just if you’re keen on data, get ready to gain the skills to make informed decisions and turn insights into real-world actions.
Join me as we dive deep into the data, one hypothesis at a time!
Before we get started, elevate your data skills with my expert eBooks—the culmination of my experiences and insights.
Support my work and enhance your journey. Check them out:
eBook 1: Personal INTERVIEW Ready “SQL” CheatSheet
eBook 2: Personal INTERVIEW Ready “Statistics” Cornell Notes
Best Selling eBook: Top 50+ ChatGPT Personas for Custom Instructions
Data Science Bundle ( Cheapest ): The Ultimate Data Science Bundle: Complete
ChatGPT Bundle ( Cheapest ): The Ultimate ChatGPT Bundle: Complete
💡 Checkout for more such resources: https://codewarepam.gumroad.com/
What is a hypothesis, and how do you test it?
A hypothesis is like a guess or prediction about something specific, such as the average income or the percentage of homeowners in a group of people.
It’s based on theories, past observations, or questions that spark our curiosity.
For instance, you might predict that the average yearly income of potential customers is over $50,000 or that 60% of them own their homes.
To see if your guess is right, you gather data from a smaller group within the larger population and check if the numbers ( like the average income, percentage of homeowners, etc. ) from this smaller group match your initial prediction.
You also set a rule for how sure you need to be to trust your findings, often using a 5% chance of error as a standard measure . This means you’re 95% confident in your results. — Level of Significance (0.05)
There are two main types of hypotheses : the null hypothesi s, which is your baseline saying there’s no change or difference, and the alternative hypothesis , which suggests there is a change or difference.
For example,
If you start with the idea that the average yearly income of potential customers is $50,000,
The alternative could be that it’s not $50,000—it could be less or more, depending on what you’re trying to find out.
To test your hypothesis, you calculate a test statistic —a number that shows how much your sample data deviates from what you predicted.
How you calculate this depends on what you’re studying and the kind of data you have. For example, to check an average, you might use a formula that considers your sample’s average, the predicted average, the variation in your sample data, and how big your sample is.
This test statistic follows a known distribution ( like the t-distribution or z-distribution ), which helps you figure out the p-value.
The p-value tells you the odds of seeing a test statistic as extreme as yours if your initial guess was correct.
A small p-value means your data strongly disagrees with your initial guess.
Finally, you decide on your hypothesis by comparing the p-value to your error threshold.
If the p-value is smaller or equal, you reject the null hypothesis, meaning your data shows a significant difference that’s unlikely due to chance.
If the p-value is larger, you stick with the null hypothesis , suggesting your data doesn’t show a meaningful difference and any change might just be by chance.
We’ll go through an example that tests if the average annual income of prospective customers exceeds $50,000.
This process involves stating hypotheses , specifying a significance level , collecting and analyzing data , and drawing conclusions based on statistical tests.
Example: Testing a Hypothesis About Average Annual Income
Step 1: state the hypotheses.
Null Hypothesis (H0): The average annual income of prospective customers is $50,000.
Alternative Hypothesis (H1): The average annual income of prospective customers is more than $50,000.
Step 2: Specify the Significance Level
Significance Level: 0.05, meaning we’re 95% confident in our findings and allow a 5% chance of error.
Step 3: Collect Sample Data
We’ll use the ProspectiveBuyer table, assuming it's a random sample from the population.
This table has 2,059 entries, representing prospective customers' annual incomes.
Step 4: Calculate the Sample Statistic
In Python, we can use libraries like Pandas and Numpy to calculate the sample mean and standard deviation.
SampleMean: 56,992.43
SampleSD: 32,079.16
SampleSize: 2,059
Step 5: Calculate the Test Statistic
We use the t-test formula to calculate how significantly our sample mean deviates from the hypothesized mean.
Python’s Scipy library can handle this calculation:
T-Statistic: 4.62
Step 6: Calculate the P-Value
The p-value is already calculated in the previous step using Scipy's ttest_1samp function, which returns both the test statistic and the p-value.
P-Value = 0.0000021
Step 7: State the Statistical Conclusion
We compare the p-value with our significance level to decide on our hypothesis:
Since the p-value is less than 0.05, we reject the null hypothesis in favor of the alternative.
Conclusion:
There’s strong evidence to suggest that the average annual income of prospective customers is indeed more than $50,000.
This example illustrates how Python can be a powerful tool for hypothesis testing, enabling us to derive insights from data through statistical analysis.
How to Choose the Right Test Statistics
Choosing the right test statistic is crucial and depends on what you’re trying to find out, the kind of data you have, and how that data is spread out.
Here are some common types of test statistics and when to use them:
T-test statistic:
This one’s great for checking out the average of a group when your data follows a normal distribution or when you’re comparing the averages of two such groups.
The t-test follows a special curve called the t-distribution . This curve looks a lot like the normal bell curve but with thicker ends, which means more chances for extreme values.
The t-distribution’s shape changes based on something called degrees of freedom , which is a fancy way of talking about your sample size and how many groups you’re comparing.
Z-test statistic:
Use this when you’re looking at the average of a normally distributed group or the difference between two group averages, and you already know the standard deviation for all in the population.
The z-test follows the standard normal distribution , which is your classic bell curve centered at zero and spreading out evenly on both sides.
Chi-square test statistic:
This is your go-to for checking if there’s a difference in variability within a normally distributed group or if two categories are related.
The chi-square statistic follows its own distribution, which leans to the right and gets its shape from the degrees of freedom —basically, how many categories or groups you’re comparing.
F-test statistic:
This one helps you compare the variability between two groups or see if the averages of more than two groups are all the same, assuming all groups are normally distributed.
The F-test follows the F-distribution , which is also right-skewed and has two types of degrees of freedom that depend on how many groups you have and the size of each group.
In simple terms, the test you pick hinges on what you’re curious about, whether your data fits the normal curve, and if you know certain specifics, like the population’s standard deviation.
Each test has its own special curve and rules based on your sample’s details and what you’re comparing.
Join my community of learners! Subscribe to my newsletter for more tips, tricks, and exclusive content on mastering Data Science & AI. — Your Data Guide Join my community of learners! Subscribe to my newsletter for more tips, tricks, and exclusive content on mastering data science and AI. By Richard Warepam ⭐️ Visit My Gumroad Shop: https://codewarepam.gumroad.com/
Ready for more?
Learning Statistics with Python
Hypothesis Testing
12. hypothesis testing #.
The process of induction is the process of assuming the simplest law that can be made to harmonize with our experience. This process, however, has no logical foundation but only a psychological one. It is clear that there are no grounds for believing that the simplest course of events will really happen. It is an hypothesis that the sun will rise tomorrow: and this means that we do not know whether it will rise. – Ludwig Wittgenstein [ 1 ]
In the last chapter, I discussed the ideas behind estimation, which is one of the two “big ideas” in inferential statistics. It’s now time to turn out attention to the other big idea, which is hypothesis testing . In its most abstract form, hypothesis testing really a very simple idea: the researcher has some theory about the world, and wants to determine whether or not the data actually support that theory. However, the details are messy, and most people find the theory of hypothesis testing to be the most frustrating part of statistics. The structure of the chapter is as follows. Firstly, I’ll describe how hypothesis testing works, in a fair amount of detail, using a simple running example to show you how a hypothesis test is “built”. I’ll try to avoid being too dogmatic while doing so, and focus instead on the underlying logic of the testing procedure. [ 2 ] Afterwards, I’ll spend a bit of time talking about the various dogmas, rules and heresies that surround the theory of hypothesis testing.
12.1. A menagerie of hypotheses #
Eventually we all succumb to madness. For me, that day will arrive once I’m finally promoted to full professor. Safely ensconced in my ivory tower, happily protected by tenure, I will finally be able to take leave of my senses (so to speak), and indulge in that most thoroughly unproductive line of psychological research: the search for extrasensory perception (ESP). [ 3 ]
Let’s suppose that this glorious day has come. My first study is a simple one, in which I seek to test whether clairvoyance exists. Each participant sits down at a table, and is shown a card by an experimenter. The card is black on one side and white on the other. The experimenter takes the card away, and places it on a table in an adjacent room. The card is placed black side up or white side up completely at random, with the randomisation occurring only after the experimenter has left the room with the participant. A second experimenter comes in and asks the participant which side of the card is now facing upwards. It’s purely a one-shot experiment. Each person sees only one card, and gives only one answer; and at no stage is the participant actually in contact with someone who knows the right answer. My data set, therefore, is very simple. I have asked the question of \(N\) people, and some number \(X\) of these people have given the correct response. To make things concrete, let’s suppose that I have tested \(N = 100\) people, and \(X = 62\) of these got the answer right… a surprisingly large number, sure, but is it large enough for me to feel safe in claiming I’ve found evidence for ESP? This is the situation where hypothesis testing comes in useful. However, before we talk about how to test hypotheses, we need to be clear about what we mean by hypotheses.
12.1.1. Research hypotheses versus statistical hypotheses #
The first distinction that you need to keep clear in your mind is between research hypotheses and statistical hypotheses. In my ESP study, my overall scientific goal is to demonstrate that clairvoyance exists. In this situation, I have a clear research goal: I am hoping to discover evidence for ESP. In other situations I might actually be a lot more neutral than that, so I might say that my research goal is to determine whether or not clairvoyance exists. Regardless of how I want to portray myself, the basic point that I’m trying to convey here is that a research hypothesis involves making a substantive, testable scientific claim… if you are a psychologist, then your research hypotheses are fundamentally about psychological constructs. Any of the following would count as research hypotheses :
Listening to music reduces your ability to pay attention to other things. This is a claim about the causal relationship between two psychologically meaningful concepts (listening to music and paying attention to things), so it’s a perfectly reasonable research hypothesis.
Intelligence is related to personality . Like the last one, this is a relational claim about two psychological constructs (intelligence and personality), but the claim is weaker: correlational not causal.
Intelligence is speed of information processing . This hypothesis has a quite different character: it’s not actually a relational claim at all. It’s an ontological claim about the fundamental character of intelligence (and I’m pretty sure it’s wrong). It’s worth expanding on this one actually: It’s usually easier to think about how to construct experiments to test research hypotheses of the form “does X affect Y?” than it is to address claims like “what is X?” And in practice, what usually happens is that you find ways of testing relational claims that follow from your ontological ones. For instance, if I believe that intelligence is speed of information processing in the brain, my experiments will often involve looking for relationships between measures of intelligence and measures of speed. As a consequence, most everyday research questions do tend to be relational in nature, but they’re almost always motivated by deeper ontological questions about the state of nature.
Notice that in practice, my research hypotheses could overlap a lot. My ultimate goal in the ESP experiment might be to test an ontological claim like “ESP exists”, but I might operationally restrict myself to a narrower hypothesis like “Some people can `see’ objects in a clairvoyant fashion”. That said, there are some things that really don’t count as proper research hypotheses in any meaningful sense:
Love is a battlefield . This is too vague to be testable. While it’s okay for a research hypothesis to have a degree of vagueness to it, it has to be possible to operationalise your theoretical ideas. Maybe I’m just not creative enough to see it, but I can’t see how this can be converted into any concrete research design. If that’s true, then this isn’t a scientific research hypothesis, it’s a pop song. That doesn’t mean it’s not interesting – a lot of deep questions that humans have fall into this category. Maybe one day science will be able to construct testable theories of love, or to test to see if God exists, and so on; but right now we can’t, and I wouldn’t bet on ever seeing a satisfying scientific approach to either.
The first rule of tautology club is the first rule of tautology club . This is not a substantive claim of any kind. It’s true by definition. No conceivable state of nature could possibly be inconsistent with this claim. As such, we say that this is an unfalsifiable hypothesis, and as such it is outside the domain of science. Whatever else you do in science, your claims must have the possibility of being wrong.
More people in my experiment will say “yes” than “no” . This one fails as a research hypothesis because it’s a claim about the data set, not about the psychology (unless of course your actual research question is whether people have some kind of “yes” bias!). As we’ll see shortly, this hypothesis is starting to sound more like a statistical hypothesis than a research hypothesis.
As you can see, research hypotheses can be somewhat messy at times; and ultimately they are scientific claims. Statistical hypotheses are neither of these two things. Statistical hypotheses must be mathematically precise, and they must correspond to specific claims about the characteristics of the data-generating mechanism (i.e., the “population”). Even so, the intent is that statistical hypotheses bear a clear relationship to the substantive research hypotheses that you care about! For instance, in my ESP study my research hypothesis is that some people are able to see through walls or whatever. What I want to do is to “map” this onto a statement about how the data were generated. So let’s think about what that statement would be. The quantity that I’m interested in within the experiment is \(P(\mbox{"correct"})\) , the true-but-unknown probability with which the participants in my experiment answer the question correctly. Let’s use the Greek letter \(\theta\) (theta) to refer to this probability. Here are four different statistical hypotheses:
If ESP doesn’t exist and if my experiment is well designed, then my participants are just guessing. So I should expect them to get it right half of the time and so my statistical hypothesis is that the true probability of choosing correctly is \(\theta = 0.5\) .
Alternatively, suppose ESP does exist and participants can see the card. If that’s true, people will perform better than chance. The statistical hypotheis would be that \(\theta > 0.5\) .
A third possibility is that ESP does exist, but the colours are all reversed and people don’t realise it (okay, that’s wacky, but you never know…). If that’s how it works then you’d expect people’s performance to be below chance. This would correspond to a statistical hypothesis that \(\theta < 0.5\) .
Finally, suppose ESP exists, but I have no idea whether people are seeing the right colour or the wrong one. In that case, the only claim I could make about the data would be that the probability of making the correct answer is not equal to 50. This corresponds to the statistical hypothesis that \(\theta \neq 0.5\) .
All of these are legitimate examples of a statistical hypothesis because they are statements about a population parameter and are meaningfully related to my experiment.
What this discussion makes clear, I hope, is that when attempting to construct a statistical hypothesis test, the researcher actually has two quite distinct hypotheses to consider. First, he or she has a research hypothesis (a claim about psychology), and this corresponds to a statistical hypothesis (a claim about the data generating population). In my ESP example, these might be
My research hypothesis: “ESP exists”
My statistical hypothesis: \(\theta \neq 0.5\)
And the key thing to recognise is this: a statistical hypothesis test is a test of the statistical hypothesis, not the research hypothesis . If your study is badly designed, then the link between your research hypothesis and your statistical hypothesis is broken. To give a silly example, suppose that my ESP study was conducted in a situation where the participant can actually see the card reflected in a window; if that happens, I would be able to find very strong evidence that \(\theta \neq 0.5\) , but this would tell us nothing about whether “ESP exists”.
12.1.2. Null hypotheses and alternative hypotheses #
So far, so good. I have a research hypothesis that corresponds to what I want to believe about the world, and I can map it onto a statistical hypothesis that corresponds to what I want to believe about how the data were generated. It’s at this point that things get somewhat counterintuitive for a lot of people. Because what I’m about to do is invent a new statistical hypothesis (the “null” hypothesis, \(H_0\) ) that corresponds to the exact opposite of what I want to believe, and then focus exclusively on that, almost to the neglect of the thing I’m actually interested in (which is now called the “alternative” hypothesis, \(H_1\) ). In our ESP example, the null hypothesis is that \(\theta = 0.5\) , since that’s what we’d expect if ESP didn’t exist. My hope, of course, is that ESP is totally real, and so the alternative to this null hypothesis is \(\theta \neq 0.5\) . In essence, what we’re doing here is dividing up the possible values of \(\theta\) into two groups: those values that I really hope aren’t true (the null), and those values that I’d be happy with if they turn out to be right (the alternative). Having done so, the important thing to recognise is that the goal of a hypothesis test is not to show that the alternative hypothesis is (probably) true; the goal is to show that the null hypothesis is (probably) false. Most people find this pretty weird.
The best way to think about it, in my experience, is to imagine that a hypothesis test is a criminal trial [ 4 ] … the trial of the null hypothesis . The null hypothesis is the defendant, the researcher is the prosecutor, and the statistical test itself is the judge. Just like a criminal trial, there is a presumption of innocence: the null hypothesis is deemed to be true unless you, the researcher, can prove beyond a reasonable doubt that it is false. You are free to design your experiment however you like (within reason, obviously!), and your goal when doing so is to maximise the chance that the data will yield a conviction… for the crime of being false. The catch is that the statistical test sets the rules of the trial, and those rules are designed to protect the null hypothesis – specifically to ensure that if the null hypothesis is actually true, the chances of a false conviction are guaranteed to be low. This is pretty important: after all, the null hypothesis doesn’t get a lawyer. And given that the researcher is trying desperately to prove it to be false, someone has to protect it.
12.2. Two types of errors #
Before going into details about how a statistical test is constructed, it’s useful to understand the philosophy behind it. I hinted at it when pointing out the similarity between a null hypothesis test and a criminal trial, but I should now be explicit. Ideally, we would like to construct our test so that we never make any errors. Unfortunately, since the world is messy, this is never possible. Sometimes you’re just really unlucky: for instance, suppose you flip a coin 10 times in a row and it comes up heads all 10 times. That feels like very strong evidence that the coin is biased (and it is!), but of course there’s a 1 in 1024 chance that this would happen even if the coin was totally fair. In other words, in real life we always have to accept that there’s a chance that we did the wrong thing. As a consequence, the goal behind statistical hypothesis testing is not to eliminate errors, but to minimise them.
At this point, we need to be a bit more precise about what we mean by “errors”. Firstly, let’s state the obvious: it is either the case that the null hypothesis is true, or it is false; and our test will either reject the null hypothesis or retain it. [ 5 ] So, as the table below illustrates, after we run the test and make our choice, one of four things might have happened:
As a consequence there are actually two different types of error here. If we reject a null hypothesis that is actually true, then we have made a type I error . On the other hand, if we retain the null hypothesis when it is in fact false, then we have made a type II error .
Remember how I said that statistical testing was kind of like a criminal trial? Well, I meant it. A criminal trial requires that you establish “beyond a reasonable doubt” that the defendant did it. All of the evidentiary rules are (in theory, at least) designed to ensure that there’s (almost) no chance of wrongfully convicting an innocent defendant. The trial is designed to protect the rights of a defendant: as the English jurist William Blackstone famously said, it is “better that ten guilty persons escape than that one innocent suffer.” In other words, a criminal trial doesn’t treat the two types of error in the same way… punishing the innocent is deemed to be much worse than letting the guilty go free. A statistical test is pretty much the same: the single most important design principle of the test is to control the probability of a type I error, to keep it below some fixed probability. This probability, which is denoted \(\alpha\) , is called the significance level of the test (or sometimes, the size of the test). And I’ll say it again, because it is so central to the whole set-up… a hypothesis test is said to have significance level \(\alpha\) if the type I error rate is no larger than \(\alpha\) .
So, what about the type II error rate? Well, we’d also like to keep those under control too, and we denote this probability by \(\beta\) . However, it’s much more common to refer to the power of the test, which is the probability with which we reject a null hypothesis when it really is false, which is \(1-\beta\) . To help keep this straight, here’s the same table again, but with the relevant numbers added:
A “powerful” hypothesis test is one that has a small value of \(\beta\) , while still keeping \(\alpha\) fixed at some (small) desired level. By convention, scientists make use of three different \(\alpha\) levels: \(.05\) , \(.01\) and \(.001\) . Notice the asymmetry here~… the tests are designed to ensure that the \(\alpha\) level is kept small, but there’s no corresponding guarantee regarding \(\beta\) . We’d certainly like the type II error rate to be small, and we try to design tests that keep it small, but this is very much secondary to the overwhelming need to control the type I error rate. As Blackstone might have said if he were a statistician, it is “better to retain 10 false null hypotheses than to reject a single true one”. To be honest, I don’t know that I agree with this philosophy – there are situations where I think it makes sense, and situations where I think it doesn’t – but that’s neither here nor there. It’s how the tests are built.
12.3. Test statistics and sampling distributions #
At this point we need to start talking specifics about how a hypothesis test is constructed. To that end, let’s return to the ESP example. Let’s ignore the actual data that we obtained, for the moment, and think about the structure of the experiment. Regardless of what the actual numbers are, the form of the data is that \(X\) out of \(N\) people correctly identified the colour of the hidden card. Moreover, let’s suppose for the moment that the null hypothesis really is true: ESP doesn’t exist, and the true probability that anyone picks the correct colour is exactly \(\theta = 0.5\) . What would we expect the data to look like? Well, obviously, we’d expect the proportion of people who make the correct response to be pretty close to 50%. Or, to phrase this in more mathematical terms, we’d say that \(X/N\) is approximately \(0.5\) . Of course, we wouldn’t expect this fraction to be exactly 0.5: if, for example we tested \(N=100\) people, and \(X = 53\) of them got the question right, we’d probably be forced to concede that the data are quite consistent with the null hypothesis. On the other hand, if \(X = 99\) of our participants got the question right, then we’d feel pretty confident that the null hypothesis is wrong. Similarly, if only \(X=3\) people got the answer right, we’d be similarly confident that the null was wrong. Let’s be a little more technical about this: we have a quantity \(X\) that we can calculate by looking at our data; after looking at the value of \(X\) , we make a decision about whether to believe that the null hypothesis is correct, or to reject the null hypothesis in favour of the alternative. The name for this thing that we calculate to guide our choices is a test statistic .
Having chosen a test statistic, the next step is to state precisely which values of the test statistic would cause us to reject the null hypothesis, and which values would cause us to keep it. In order to do so, we need to determine what the sampling distribution of the test statistic would be if the null hypothesis were actually true (we talked about sampling distributions earlier). Why do we need this? Because this distribution tells us exactly what values of \(X\) our null hypothesis would lead us to expect. And therefore, we can use this distribution as a tool for assessing how closely the null hypothesis agrees with our data. Using random.binomial from numpy , we can estimate a binomial distribution with a \(\theta = 0.5\) , e.g. estimating from 10,000 trials:

How do we actually determine the sampling distribution of the test statistic? For a lot of hypothesis tests this step is actually quite complicated, and later on in the book you’ll see me being slightly evasive about it for some of the tests (some of them I don’t even understand myself). However, sometimes it’s very easy. And, fortunately for us, our ESP example provides us with one of the easiest cases. Our population parameter \(\theta\) is just the overall probability that people respond correctly when asked the question, and our test statistic \(X\) is the count of the number of people who did so, out of a sample size of \(N\) . We’ve seen a distribution like this before, in the section on the binomial distribution : that’s exactly what the binomial distribution describes! So, to use the notation and terminology that I introduced in that section, we would say that the null hypothesis predicts that \(X\) is binomially distributed, which is written
Since the null hypothesis states that \(\theta = 0.5\) and our experiment has \(N=100\) people, we have the sampling distribution we need. This sampling distribution is plotted in Figure fig-esp-estimation . No surprises really: the null hypothesis says that \(X=50\) is the most likely outcome, and it says that we’re almost certain to see somewhere between 40 and 60 correct responses.
12.4. Making decisions #
Okay, we’re very close to being finished. We’ve constructed a test statistic ( \(X\) ), and we chose this test statistic in such a way that we’re pretty confident that if \(X\) is close to \(N/2\) then we should retain the null, and if not we should reject it. The question that remains is this: exactly which values of the test statistic should we associate with the null hypothesis, and which exactly values go with the alternative hypothesis? In my ESP study, for example, I’ve observed a value of \(X=62\) . What decision should I make? Should I choose to believe the null hypothesis, or the alternative hypothesis?
12.4.1. Critical regions and critical values #
To answer this question, we need to introduce the concept of a critical region for the test statistic \(X\) . The critical region of the test corresponds to those values of \(X\) that would lead us to reject the null hypothesis (which is why the critical region is also sometimes called the rejection region). How do we find this critical region? Well, let’s consider what we know:
\(X\) should be very big or very small in order to reject the null hypothesis.
If the null hypothesis is true, the sampling distribution of \(X\) is Binomial \((0.5, N)\) .
If \(\alpha =.05\) , the critical region must cover 5% of this sampling distribution.
It’s important to make sure you understand this last point: the critical region corresponds to those values of \(X\) for which we would reject the null hypothesis, and the sampling distribution in question describes the probability that we would obtain a particular value of \(X\) if the null hypothesis were actually true. Now, let’s suppose that we chose a critical region that covers 20% of the sampling distribution, and suppose that the null hypothesis is actually true. What would be the probability of incorrectly rejecting the null? The answer is of course 20%. And therefore, we would have built a test that had an \(\alpha\) level of \(0.2\) . If we want \(\alpha = .05\) , the critical region is only allowed to cover 5% of the sampling distribution of our test statistic.

As it turns out, those three things uniquely solve the problem: our critical region consists of the most extreme values , known as the tails of the distribution. This is illustrated in fig-esp-critical . As it turns out, if we want \(\alpha = .05\) , then our critical regions correspond to \(X \leq 40\) and \(X \geq 60\) . [ 6 ] That is, if the number of people saying “true” is between 41 and 59, then we should retain the null hypothesis. If the number is between 0 to 40 or between 60 to 100, then we should reject the null hypothesis. The numbers 40 and 60 are often referred to as the critical values , since they define the edges of the critical region.
At this point, our hypothesis test is essentially complete: (1) we choose an \(\alpha\) level (e.g., \(\alpha = .05\) , (2) come up with some test statistic (e.g., \(X\) ) that does a good job (in some meaningful sense) of comparing \(H_0\) to \(H_1\) , (3) figure out the sampling distribution of the test statistic on the assumption that the null hypothesis is true (in this case, binomial) and then (4) calculate the critical region that produces an appropriate \(\alpha\) level (0-40 and 60-100). All that we have to do now is calculate the value of the test statistic for the real data (e.g., \(X = 62\) ) and then compare it to the critical values to make our decision. Since 62 is greater than the critical value of 60, we would reject the null hypothesis. Or, to phrase it slightly differently, we say that the test has produced a significant result.
12.4.2. A note on statistical “significance” #
Like other occult techniques of divination, the statistical method has a private jargon deliberately contrived to obscure its methods from non-practitioners. – Attributed to G. O. Ashley [ 7 ]
A very brief digression is in order at this point, regarding the word “significant”. The concept of statistical significance is actually a very simple one, but has a very unfortunate name. If the data allow us to reject the null hypothesis, we say that “the result is statistically significant ”, which is often shortened to “the result is significant”. This terminology is rather old, and dates back to a time when “significant” just meant something like “indicated”, rather than its modern meaning, which is much closer to “important”. As a result, a lot of modern readers get very confused when they start learning statistics, because they think that a “significant result” must be an important one. It doesn’t mean that at all. All that “statistically significant” means is that the data allowed us to reject a null hypothesis. Whether or not the result is actually important in the real world is a very different question, and depends on all sorts of other things.
12.4.3. The difference between one sided and two sided tests #
There’s one more thing I want to point out about the hypothesis test that I’ve just constructed. If we take a moment to think about the statistical hypotheses I’ve been using,
we notice that the alternative hypothesis covers both the possibility that \(\theta < .5\) and the possibility that \(\theta > .5\) . This makes sense if I really think that ESP could produce better-than-chance performance or worse-than-chance performance (and there are some people who think that). In statistical language, this is an example of a two-sided test . It’s called this because the alternative hypothesis covers the area on both “sides” of the null hypothesis, and as a consequence the critical region of the test covers both tails of the sampling distribution (2.5% on either side if \(\alpha =.05\) ), as illustrated earlier in fig-esp-critical .
However, that’s not the only possibility. It might be the case, for example, that I’m only willing to believe in ESP if it produces better than chance performance. If so, then my alternative hypothesis would only cover the possibility that \(\theta > .5\) , and as a consequence the null hypothesis now becomes \(\theta \leq .5\) :
When this happens, we have what’s called a one-sided test , and when this happens the critical region only covers one tail of the sampling distribution. This is illustrated in fig-esp-critical-onesided .

12.5. The \(p\) value of a test #
In one sense, our hypothesis test is complete; we’ve constructed a test statistic, figured out its sampling distribution if the null hypothesis is true, and then constructed the critical region for the test. Nevertheless, I’ve actually omitted the most important number of all: the \(p\) value . It is to this topic that we now turn. There are two somewhat different ways of interpreting a \(p\) value, one proposed by Sir Ronald Fisher and the other by Jerzy Neyman. Both versions are legitimate, though they reflect very different ways of thinking about hypothesis tests. Most introductory textbooks tend to give Fisher’s version only, but I think that’s a bit of a shame. To my mind, Neyman’s version is cleaner, and actually better reflects the logic of the null hypothesis test. You might disagree though, so I’ve included both. I’ll start with Neyman’s version…
12.5.1. A softer view of decision making #
One problem with the hypothesis testing procedure that I’ve described is that it makes no distinction at all between a result this “barely significant” and those that are “highly significant”. For instance, in my ESP study the data I obtained only just fell inside the critical region - so I did get a significant effect, but was a pretty near thing. In contrast, suppose that I’d run a study in which \(X=97\) out of my \(N=100\) participants got the answer right. This would obviously be significant too, but by a much larger margin; there’s really no ambiguity about this at all. The procedure that I described makes no distinction between the two. If I adopt the standard convention of allowing \(\alpha = .05\) as my acceptable Type I error rate, then both of these are significant results.
This is where the \(p\) value comes in handy. To understand how it works, let’s suppose that we ran lots of hypothesis tests on the same data set: but with a different value of \(\alpha\) in each case. When we do that for my original ESP data, what we’d get is something like this
When we test ESP data ( \(X=62\) successes out of \(N=100\) observations) using \(\alpha\) levels of .03 and above, we’d always find ourselves rejecting the null hypothesis. For \(\alpha\) levels of .02 and below, we always end up retaining the null hypothesis. Therefore, somewhere between .02 and .03 there must be a smallest value of \(\alpha\) that would allow us to reject the null hypothesis for this data. This is the \(p\) value; as it turns out the ESP data has \(p = .021\) . In short:
\(p\) is defined to be the smallest Type I error rate ( \(\alpha\) ) that you have to be willing to tolerate if you want to reject the null hypothesis.
If it turns out that \(p\) describes an error rate that you find intolerable, then you must retain the null. If you’re comfortable with an error rate equal to \(p\) , then it’s okay to reject the null hypothesis in favour of your preferred alternative.
In effect, \(p\) is a summary of all the possible hypothesis tests that you could have run, taken across all possible \(\alpha\) values. And as a consequence it has the effect of “softening” our decision process. For those tests in which \(p \leq \alpha\) you would have rejected the null hypothesis, whereas for those tests in which \(p > \alpha\) you would have retained the null. In my ESP study I obtained \(X=62\) , and as a consequence I’ve ended up with \(p = .021\) . So the error rate I have to tolerate is 2.1%. In contrast, suppose my experiment had yielded \(X=97\) . What happens to my \(p\) value now? This time it’s shrunk to \(p = 1.36 \times 10^{-25}\) , which is a tiny, tiny [ 8 ] Type I error rate. For this second case I would be able to reject the null hypothesis with a lot more confidence, because I only have to be “willing” to tolerate a type I error rate of about 1 in 10 trillion trillion in order to justify my decision to reject.
12.5.2. The probability of extreme data #
The second definition of the \(p\) -value comes from Sir Ronald Fisher, and it’s actually this one that you tend to see in most introductory statistics textbooks. Notice how, when I constructed the critical region, it corresponded to the tails (i.e., extreme values) of the sampling distribution? That’s not a coincidence: almost all “good” tests have this characteristic (good in the sense of minimising our type II error rate, \(\beta\) ). The reason for that is that a good critical region almost always corresponds to those values of the test statistic that are least likely to be observed if the null hypothesis is true. If this rule is true, then we can define the \(p\) -value as the probability that we would have observed a test statistic that is at least as extreme as the one we actually did get. In other words, if the data are extremely implausible according to the null hypothesis, then the null hypothesis is probably wrong.
12.5.3. A common mistake #
Okay, so you can see that there are two rather different but legitimate ways to interpret the \(p\) value, one based on Neyman’s approach to hypothesis testing and the other based on Fisher’s. Unfortunately, there is a third explanation that people sometimes give, especially when they’re first learning statistics, and it is absolutely and completely wrong . This mistaken approach is to refer to the \(p\) value as “the probability that the null hypothesis is true”. It’s an intuitively appealing way to think, but it’s wrong in two key respects: (1) null hypothesis testing is a frequentist tool, and the frequentist approach to probability does not allow you to assign probabilities to the null hypothesis… according to this view of probability, the null hypothesis is either true or it is not; it cannot have a “5% chance” of being true. (2) even within the Bayesian approach, which does let you assign probabilities to hypotheses, the \(p\) value would not correspond to the probability that the null is true; this interpretation is entirely inconsistent with the mathematics of how the \(p\) value is calculated. Put bluntly, despite the intuitive appeal of thinking this way, there is no justification for interpreting a \(p\) value this way. Never do it.
12.6. Reporting the results of a hypothesis test #
When writing up the results of a hypothesis test, there’s usually several pieces of information that you need to report, but it varies a fair bit from test to test. Throughout the rest of the book I’ll spend a little time talking about how to report the results of different tests (see Section @ref(chisqreport) for a particularly detailed example), so that you can get a feel for how it’s usually done. However, regardless of what test you’re doing, the one thing that you always have to do is say something about the \(p\) value, and whether or not the outcome was significant.
The fact that you have to do this is unsurprising; it’s the whole point of doing the test. What might be surprising is the fact that there is some contention over exactly how you’re supposed to do it. Leaving aside those people who completely disagree with the entire framework underpinning null hypothesis testing, there’s a certain amount of tension that exists regarding whether or not to report the exact \(p\) value that you obtained, or if you should state only that \(p < \alpha\) for a significance level that you chose in advance (e.g., \(p<.05\) ).
12.6.1. The issue #
To see why this is an issue, the key thing to recognise is that \(p\) values are terribly convenient. In practice, the fact that we can compute a \(p\) value means that we don’t actually have to specify any \(\alpha\) level at all in order to run the test. Instead, what you can do is calculate your \(p\) value and interpret it directly: if you get \(p = .062\) , then it means that you’d have to be willing to tolerate a Type I error rate of 6.2% to justify rejecting the null. If you personally find 6.2% intolerable, then you retain the null. Therefore, the argument goes, why don’t we just report the actual \(p\) value and let the reader make up their own minds about what an acceptable Type I error rate is? This approach has the big advantage of “softening” the decision making process – in fact, if you accept the Neyman definition of the \(p\) value, that’s the whole point of the \(p\) value. We no longer have a fixed significance level of \(\alpha = .05\) as a bright line separating “accept” from “reject” decisions; and this removes the rather pathological problem of being forced to treat \(p = .051\) in a fundamentally different way to \(p = .049\) .
This flexibility is both the advantage and the disadvantage to the \(p\) value. The reason why a lot of people don’t like the idea of reporting an exact \(p\) value is that it gives the researcher a bit too much freedom. In particular, it lets you change your mind about what error tolerance you’re willing to put up with after you look at the data. For instance, consider my ESP experiment. Suppose I ran my test, and ended up with a \(p\) value of .09. Should I accept or reject? Now, to be honest, I haven’t yet bothered to think about what level of Type I error I’m “really” willing to accept. I don’t have an opinion on that topic. But I do have an opinion about whether or not ESP exists, and I definitely have an opinion about whether my research should be published in a reputable scientific journal. And amazingly, now that I’ve looked at the data I’m starting to think that a 9% error rate isn’t so bad, especially when compared to how annoying it would be to have to admit to the world that my experiment has failed. So, to avoid looking like I just made it up after the fact, I now say that my \(\alpha\) is .1: a 10% type I error rate isn’t too bad, and at that level my test is significant! I win.
In other words, the worry here is that I might have the best of intentions, and be the most honest of people, but the temptation to just “shade” things a little bit here and there is really, really strong. As anyone who has ever run an experiment can attest, it’s a long and difficult process, and you often get very attached to your hypotheses. It’s hard to let go and admit the experiment didn’t find what you wanted it to find. And that’s the danger here. If we use the “raw” \(p\) -value, people will start interpreting the data in terms of what they want to believe, not what the data are actually saying… and if we allow that, well, why are we bothering to do science at all? Why not let everyone believe whatever they like about anything, regardless of what the facts are? Okay, that’s a bit extreme, but that’s where the worry comes from. According to this view, you really must specify your \(\alpha\) value in advance, and then only report whether the test was significant or not. It’s the only way to keep ourselves honest.
12.6.2. Two proposed solutions #
In practice, it’s pretty rare for a researcher to specify a single \(\alpha\) level ahead of time. Instead, the convention is that scientists rely on three standard significance levels: .05, .01 and .001. When reporting your results, you indicate which (if any) of these significance levels allow you to reject the null hypothesis. This is summarised in the table below. This allows us to soften the decision rule a little bit, since \(p<.01\) implies that the data meet a stronger evidentiary standard than \(p<.05\) would. Nevertheless, since these levels are fixed in advance by convention, it does prevent people choosing their \(\alpha\) level after looking at the data.
Nevertheless, quite a lot of people still prefer to report exact \(p\) values. To many people, the advantage of allowing the reader to make up their own mind about how to interpret \(p = .06\) outweighs any disadvantages. In practice, however, even among those researchers who prefer exact \(p\) values it is quite common to just write \(p<.001\) instead of reporting an exact value for small \(p\) . This is in part because a lot of software doesn’t actually print out the \(p\) value when it’s that small (e.g., SPSS just writes \(p = .000\) whenever \(p<.001\) ), and in part because a very small \(p\) value can be kind of misleading. The human mind sees a number like .0000000001 and it’s hard to suppress the gut feeling that the evidence in favour of the alternative hypothesis is a near certainty. In practice however, this is usually wrong. Life is a big, messy, complicated thing: and every statistical test ever invented relies on simplifications, approximations and assumptions. As a consequence, it’s probably not reasonable to walk away from any statistical analysis with a feeling of confidence stronger than \(p<.001\) implies. In other words, \(p<.001\) is really code for “as far as this test is concerned, the evidence is overwhelming.”
In light of all this, you might be wondering exactly what you should do. There’s a fair bit of contradictory advice on the topic, with some people arguing that you should report the exact \(p\) value, and other people arguing that you should use the tiered approach illustrated in the table above. As a result, the best advice I can give is to suggest that you look at papers/reports written in your field and see what the convention seems to be. If there doesn’t seem to be any consistent pattern, then use whichever method you prefer.
12.7. Running the hypothesis test in practice #
At this point some of you might be wondering if this is a “real” hypothesis test, or just a toy example that I made up. It’s real. In the previous discussion I built the test from first principles, thinking that it was the simplest possible problem that you might ever encounter in real life. However, this test already exists: it’s called the binomial test , and it’s implemented in a function called binom_test() from the scipy.stats package. To test the null hypothesis that the response probability is one-half p = .5 , [ 9 ] using data in which x = 62 of n = 100 people made the correct response, here’s how to do it in Python:
Well. There’s a number, but what does it mean? Sometimes the output of these Python functions can be fairly terse. But here binom_test() is giving us the \(p\) -value for the test we specified. In this case, the \(p\) -value of 0.02 is less than the usual choice of \(\alpha = .05\) , so we can reject the null. Usually we will want to know more than just the \(p\) -value for a test, and Python has ways of giving us this information, but for now, however, I just wanted to make the point that Python packages contain a whole lot of functions corresponding to different kinds of hypothesis test. And while I’ll usually spend quite a lot of time explaining the logic behind how the tests are built, every time I discuss a hypothesis test the discussion will end with me showing you a fairly simple Python command that you can use to run the test in practice.
12.8. Effect size, sample size and power #
In previous sections I’ve emphasised the fact that the major design principle behind statistical hypothesis testing is that we try to control our Type I error rate. When we fix \(\alpha = .05\) we are attempting to ensure that only 5% of true null hypotheses are incorrectly rejected. However, this doesn’t mean that we don’t care about Type II errors. In fact, from the researcher’s perspective, the error of failing to reject the null when it is actually false is an extremely annoying one. With that in mind, a secondary goal of hypothesis testing is to try to minimise \(\beta\) , the Type II error rate, although we don’t usually talk in terms of minimising Type II errors. Instead, we talk about maximising the power of the test. Since power is defined as \(1-\beta\) , this is the same thing.

12.8.1. The power function #
Let’s take a moment to think about what a Type II error actually is. A Type II error occurs when the alternative hypothesis is true, but we are nevertheless unable to reject the null hypothesis. Ideally, we’d be able to calculate a single number \(\beta\) that tells us the Type II error rate, in the same way that we can set \(\alpha = .05\) for the Type I error rate. Unfortunately, this is a lot trickier to do. To see this, notice that in my ESP study the alternative hypothesis actually corresponds to lots of possible values of \(\theta\) . In fact, the alternative hypothesis corresponds to every value of \(\theta\) except 0.5. Let’s suppose that the true probability of someone choosing the correct response is 55% (i.e., \(\theta = .55\) ). If so, then the true sampling distribution for \(X\) is not the same one that the null hypothesis predicts: the most likely value for \(X\) is now 55 out of 100. Not only that, the whole sampling distribution has now shifted, as shown in fig-esp-alternative . The critical regions, of course, do not change: by definition, the critical regions are based on what the null hypothesis predicts. What we’re seeing in this figure is the fact that when the null hypothesis is wrong, a much larger proportion of the sampling distribution distribution falls in the critical region. And of course that’s what should happen: the probability of rejecting the null hypothesis is larger when the null hypothesis is actually false! However \(\theta = .55\) is not the only possibility consistent with the alternative hypothesis. Let’s instead suppose that the true value of \(\theta\) is actually 0.7. What happens to the sampling distribution when this occurs? The answer, shown in fig-esp-alternative2 , is that almost the entirety of the sampling distribution has now moved into the critical region. Therefore, if \(\theta = 0.7\) the probability of us correctly rejecting the null hypothesis (i.e., the power of the test) is much larger than if \(\theta = 0.55\) . In short, while \(\theta = .55\) and \(\theta = .70\) are both part of the alternative hypothesis, the Type II error rate is different.

What all this means is that the power of a test (i.e., \(1-\beta\) ) depends on the true value of \(\theta\) . To illustrate this, I’ve calculated the expected probability of rejecting the null hypothesis for all values of \(\theta\) , and plotted it in fig-powerfunction . This plot describes what is usually called the power function of the test. It’s a nice summary of how good the test is, because it actually tells you the power ( \(1-\beta\) ) for all possible values of \(\theta\) . As you can see, when the true value of \(\theta\) is very close to 0.5, the power of the test drops very sharply, but when it is further away, the power is large.

12.8.2. Effect size #
Since all models are wrong the scientist must be alert to what is importantly wrong. It is inappropriate to be concerned with mice when there are tigers abroad – George Box 1976
The plot shown in fig-powerfunction captures a fairly basic point about hypothesis testing. If the true state of the world is very different from what the null hypothesis predicts, then your power will be very high; but if the true state of the world is similar to the null (but not identical) then the power of the test is going to be very low. Therefore, it’s useful to be able to have some way of quantifying how “similar” the true state of the world is to the null hypothesis. A statistic that does this is called a measure of effect size (e.g. [ Cohen, 1988 ] or [ Ellis, 2010 ] ). Effect size is defined slightly differently in different contexts (and so this section just talks in general terms) but the qualitative idea that it tries to capture is always the same: how big is the difference between the true population parameters, and the parameter values that are assumed by the null hypothesis? In our ESP example, if we let \(\theta_0 = 0.5\) denote the value assumed by the null hypothesis, and let \(\theta\) denote the true value, then a simple measure of effect size could be something like the difference between the true value and null (i.e., \(\theta - \theta_0\) ), or possibly just the magnitude of this difference, \(\mbox{abs}(\theta - \theta_0)\) .
Why calculate effect size? Let’s assume that you’ve run your experiment, collected the data, and gotten a significant effect when you ran your hypothesis test. Isn’t it enough just to say that you’ve gotten a significant effect? Surely that’s the point of hypothesis testing? Well, sort of. Yes, the point of doing a hypothesis test is to try to demonstrate that the null hypothesis is wrong, but that’s hardly the only thing we’re interested in. If the null hypothesis claimed that \(\theta = .5\) , and we show that it’s wrong, we’ve only really told half of the story. Rejecting the null hypothesis implies that we believe that \(\theta \neq .5\) , but there’s a big difference between \(\theta = .51\) and \(\theta = .8\) . If we find that \(\theta = .8\) , then not only have we found that the null hypothesis is wrong, it appears to be very wrong. On the other hand, suppose we’ve successfully rejected the null hypothesis, but it looks like the true value of \(\theta\) is only .51 (this would only be possible with a large study). Sure, the null hypothesis is wrong, but it’s not at all clear that we actually care , because the effect size is so small. In the context of my ESP study we might still care, since any demonstration of real psychic powers would actually be pretty cool [ 10 ] , but in other contexts a 1% difference isn’t very interesting, even if it is a real difference. For instance, suppose we’re looking at differences in high school exam scores between males and females, and it turns out that the female scores are 1% higher on average than the males. If I’ve got data from thousands of students, then this difference will almost certainly be statistically significant , but regardless of how small the \(p\) value is it’s just not very interesting. You’d hardly want to go around proclaiming a crisis in boys education on the basis of such a tiny difference would you? It’s for this reason that it is becoming more standard (slowly, but surely) to report some kind of standard measure of effect size along with the the results of the hypothesis test. The hypothesis test itself tells you whether you should believe that the effect you have observed is real (i.e., not just due to chance); the effect size tells you whether or not you should care.
12.8.3. Increasing the power of your study #
Not surprisingly, scientists are fairly obsessed with maximising the power of their experiments. We want our experiments to work, and so we want to maximise the chance of rejecting the null hypothesis if it is false (and of course we usually want to believe that it is false!) As we’ve seen, one factor that influences power is the effect size. So the first thing you can do to increase your power is to increase the effect size. In practice, what this means is that you want to design your study in such a way that the effect size gets magnified. For instance, in my ESP study I might believe that psychic powers work best in a quiet, darkened room; with fewer distractions to cloud the mind. Therefore I would try to conduct my experiments in just such an environment: if I can strengthen people’s ESP abilities somehow, then the true value of \(\theta\) will go up [ 11 ] and therefore my effect size will be larger. In short, clever experimental design is one way to boost power; because it can alter the effect size.
Unfortunately, it’s often the case that even with the best of experimental designs you may have only a small effect. Perhaps, for example, ESP really does exist, but even under the best of conditions it’s very very weak. Under those circumstances, your best bet for increasing power is to increase the sample size. In general, the more observations that you have available, the more likely it is that you can discriminate between two hypotheses. If I ran my ESP experiment with 10 participants, and 7 of them correctly guessed the colour of the hidden card, you wouldn’t be terribly impressed. But if I ran it with 10,000 participants and 7,000 of them got the answer right, you would be much more likely to think I had discovered something. In other words, power increases with the sample size. This is illustrated in fig-powerfunctionsample , which shows the power of the test for a true parameter of \(\theta = 0.7\) , for all sample sizes \(N\) from 1 to 100, where I’m assuming that the null hypothesis predicts that \(\theta_0 = 0.5\) .

Because power is important, whenever you’re contemplating running an experiment it would be pretty useful to know how much power you’re likely to have. It’s never possible to know for sure, since you can’t possibly know what your effect size is. However, it’s often (well, sometimes) possible to guess how big it should be. If so, you can guess what sample size you need! This idea is called power analysis , and if it’s feasible to do it, then it’s very helpful, since it can tell you something about whether you have enough time or money to be able to run the experiment successfully. It’s increasingly common to see people arguing that power analysis should be a required part of experimental design, so it’s worth knowing about. I don’t discuss power analysis in this book, however. This is partly for a boring reason and partly for a substantive one. The boring reason is that I haven’t had time to write about power analysis yet. The substantive one is that I’m still a little suspicious of power analysis. Speaking as a researcher, I have very rarely found myself in a position to be able to do one – it’s either the case that (a) my experiment is a bit non-standard and I don’t know how to define effect size properly, or (b) I literally have so little idea about what the effect size will be that I wouldn’t know how to interpret the answers. Not only that, after extensive conversations with someone who does stats consulting for a living (my wife, as it happens), I can’t help but notice that in practice the only time anyone ever asks her for a power analysis is when she’s helping someone write a grant application. In other words, the only time any scientist ever seems to want a power analysis in real life is when they’re being forced to do it by bureaucratic process. It’s not part of anyone’s day to day work. In short, I’ve always been of the view that while power is an important concept, power analysis is not as useful as people make it sound, except in the rare cases where (a) someone has figured out how to calculate power for your actual experimental design and (b) you have a pretty good idea what the effect size is likely to be. Maybe other people have had better experiences than me, but I’ve personally never been in a situation where both (a) and (b) were true. Maybe I’ll be convinced otherwise in the future, and probably a future version of this book would include a more detailed discussion of power analysis, but for now this is about as much as I’m comfortable saying about the topic.
12.9. Some issues to consider #
What I’ve described to you in this chapter is the orthodox framework for null hypothesis significance testing (NHST). Understanding how NHST works is an absolute necessity, since it has been the dominant approach to inferential statistics ever since it came to prominence in the early 20th century. It’s what the vast majority of working scientists rely on for their data analysis, so even if you hate it you need to know it. However, the approach is not without problems. There are a number of quirks in the framework, historical oddities in how it came to be, theoretical disputes over whether or not the framework is right, and a lot of practical traps for the unwary. I’m not going to go into a lot of detail on this topic, but I think it’s worth briefly discussing a few of these issues.
12.9.1. Neyman versus Fisher #
The first thing you should be aware of is that orthodox NHST is actually a mash-up of two rather different approaches to hypothesis testing, one proposed by Sir Ronald Fisher and the other proposed by Jerzy Neyman (for a historical summary see [ Lehmann, 2011 ] . The history is messy because Fisher and Neyman were real people whose opinions changed over time, and at no point did either of them offer “the definitive statement” of how we should interpret their work many decades later. That said, here’s a quick summary of what I take these two approaches to be.
First, let’s talk about Fisher’s approach. As far as I can tell, Fisher assumed that you only had the one hypothesis (the null), and what you want to do is find out if the null hypothesis is inconsistent with the data. From his perspective, what you should do is check to see if the data are “sufficiently unlikely” according to the null. In fact, if you remember back to our earlier discussion, that’s how Fisher defines the \(p\) -value. According to Fisher, if the null hypothesis provided a very poor account of the data, you could safely reject it. But, since you don’t have any other hypotheses to compare it to, there’s no way of “accepting the alternative” because you don’t necessarily have an explicitly stated alternative. That’s more or less all that there was to it.
In contrast, Neyman thought that the point of hypothesis testing was as a guide to action, and his approach was somewhat more formal than Fisher’s. His view was that there are multiple things that you could do (accept the null or accept the alternative) and the point of the test was to tell you which one the data support. From this perspective, it is critical to specify your alternative hypothesis properly. If you don’t know what the alternative hypothesis is, then you don’t know how powerful the test is, or even which action makes sense. His framework genuinely requires a competition between different hypotheses. For Neyman, the \(p\) value didn’t directly measure the probability of the data (or data more extreme) under the null, it was more of an abstract description about which “possible tests” were telling you to accept the null, and which “possible tests” were telling you to accept the alternative.
As you can see, what we have today is an odd mishmash of the two. We talk about having both a null hypothesis and an alternative (Neyman), but usually [ 12 ] define the \(p\) value in terms of exreme data (Fisher), but we still have \(\alpha\) values (Neyman). Some of the statistical tests have explicitly specified alternatives (Neyman) but others are quite vague about it (Fisher). And, according to some people at least, we’re not allowed to talk about accepting the alternative (Fisher). It’s a mess: but I hope this at least explains why it’s a mess.
12.9.2. Bayesians versus frequentists #
Earlier on in this chapter I was quite emphatic about the fact that you cannot interpret the \(p\) value as the probability that the null hypothesis is true. NHST is fundamentally a frequentist tool (see the chapter on probability ) and as such it does not allow you to assign probabilities to hypotheses: the null hypothesis is either true or it is not. The Bayesian approach to statistics interprets probability as a degree of belief, so it’s totally okay to say that there is a 10% chance that the null hypothesis is true: that’s just a reflection of the degree of confidence that you have in this hypothesis. You aren’t allowed to do this within the frequentist approach. Remember, if you’re a frequentist, a probability can only be defined in terms of what happens after a large number of independent replications (i.e., a long run frequency). If this is your interpretation of probability, talking about the “probability” that the null hypothesis is true is complete gibberish: a null hypothesis is either true or it is false. There’s no way you can talk about a long run frequency for this statement. To talk about “the probability of the null hypothesis” is as meaningless as “the colour of freedom”. It doesn’t have one!
Most importantly, this isn’t a purely ideological matter. If you decide that you are a Bayesian and that you’re okay with making probability statements about hypotheses, you have to follow the Bayesian rules for calculating those probabilities. I’ll talk more about this in the chapter on Bayesian statistics , but for now what I want to point out to you is the \(p\) value is a terrible approximation to the probability that \(H_0\) is true. If what you want to know is the probability of the null, then the \(p\) value is not what you’re looking for!
12.9.3. Traps #
As you can see, the theory behind hypothesis testing is a mess, and even now there are arguments in statistics about how it “should” work. However, disagreements among statisticians are not our real concern here. Our real concern is practical data analysis. And while the “orthodox” approach to null hypothesis significance testing has many drawbacks, even an unrepentant Bayesian like myself would agree that they can be useful if used responsibly. Most of the time they give sensible answers, and you can use them to learn interesting things. Setting aside the various ideologies and historical confusions that we’ve discussed, the fact remains that the biggest danger in all of statistics is thoughtlessness . I don’t mean stupidity, here: I literally mean thoughtlessness. The rush to interpret a result without spending time thinking through what each test actually says about the data, and checking whether that’s consistent with how you’ve interpreted it. That’s where the biggest trap lies.
To give an example of this, consider the following example see [ Gelman and Stern, 2006 ] . Suppose I’m running my ESP study, and I’ve decided to analyse the data separately for the male participants and the female participants. Of the male participants, 33 out of 50 guessed the colour of the card correctly. This is a significant effect ( \(p = .03\) ). Of the female participants, 29 out of 50 guessed correctly. This is not a significant effect ( \(p = .32\) ). Upon observing this, it is extremely tempting for people to start wondering why there is a difference between males and females in terms of their psychic abilities. However, this is wrong. If you think about it, we haven’t actually run a test that explicitly compares males to females. All we have done is compare males to chance (binomial test was significant) and compared females to chance (binomial test was non significant). If we want to argue that there is a real difference between the males and the females, we should probably run a test of the null hypothesis that there is no difference! We can do that using a different hypothesis test, [ 13 ] but when we do that it turns out that we have no evidence that males and females are significantly different ( \(p = .54\) ). Now do you think that there’s anything fundamentally different between the two groups? Of course not. What’s happened here is that the data from both groups (male and female) are pretty borderline: by pure chance, one of them happened to end up on the magic side of the \(p = .05\) line, and the other one didn’t. That doesn’t actually imply that males and females are different. This mistake is so common that you should always be wary of it: the difference between significant and not-significant is not evidence of a real difference – if you want to say that there’s a difference between two groups, then you have to test for that difference!
The example above is just that: an example. I’ve singled it out because it’s such a common one, but the bigger picture is that data analysis can be tricky to get right. Think about what it is you want to test, why you want to test it, and whether or not the answers that your test gives could possibly make any sense in the real world.
12.10. Summary #
Null hypothesis testing is one of the most ubiquitous elements to statistical theory. The vast majority of scientific papers report the results of some hypothesis test or another. As a consequence it is almost impossible to get by in science without having at least a cursory understanding of what a \(p\) -value means, making this one of the most important chapters in the book. As usual, I’ll end the chapter with a quick recap of the key ideas that we’ve talked about:
Research hypotheses and statistical hypotheses . Null and alternative hypotheses .
Type 1 and Type 2 errors
Test statistics and sampling distributions
Hypothesis testing as a decision making process
\(p\) -values as “soft” decisions
Writing up the results of a hypothesis test
Effect size and power
A few issues to consider regarding hypothesis testing
Later in the book, in the section on Bayesian statistics , I’ll revisit the theory of null hypothesis tests from a Bayesian perspective, and introduce a number of new tools that you can use if you aren’t particularly fond of the orthodox approach. But for now, though, we’re done with the abstract statistical theory, and we can start discussing specific data analysis tools.
Statistical Hypothesis Testing: A Comprehensive Guide

We’ve all heard it – “ go to college to get a good job .” The assumption is that higher education leads straight to higher incomes. Elite Indian institutes like the IITs and IIMs are even judged based on the average starting salaries of their graduates. But is this direct connection between schooling and income actually true?
Intuitively, it seems believable. But how can we really prove this assumption that more school = more money? Is there hard statistical evidence either way? Turns out, there are methods to scientifically test widespread beliefs like this – what statisticians call hypothesis testing.
In this article, we’ll dig into the concept of hypothesis testing and the tools to rigorously question conventional wisdom: null and alternate hypotheses, one and two-tailed tests, paired sample tests, and more.
Statistical hypothesis testing allows researchers to make inferences about populations based on sample data. It involves setting up a null hypothesis, choosing a confidence level, calculating a p-value, and conducting tests such as two-tailed, one-tailed, or paired sample tests to draw conclusions.
What is Hypothesis Testing?
Statistical Hypothesis Testing is a method used to make inferences about a population based on sample data. Before we move ahead and understand what Hypothesis Testing is, we need to understand some basic terms.
Null Hypothesis
The Null Hypothesis is generally where we start our journey. Null Hypotheses are statements that are generally accepted or statements that you want to challenge. Since it is generally accepted that income level is positively correlated with quality of education, this will be our Null Hypothesis. It is denoted by H 0 .
H 0 : Income levels are positively correlated with quality of education.
Alternate Hypothesis
The Alternate Hypothesis is the opposite of the Null hypothesis. An alternate Hypothesis is what we want to prove as a researcher and is not generally accepted by society. An alternate hypothesis is denoted H a . The alternate hypothesis of the above is given below.
H a : Income levels are negatively correlated with the quality of education.
Confidence Level (1- α )
Confidence Levels represent the probability that the range of values contains the true parameter value. The most common confidence levels are 95% and 99%. It can be interpreted that our test is 95% accurate if our confidence level is 95%. It is denoted by 1-α.
p-value ( p )
The p-value represents the probability of obtaining test results at least as extreme as the results actually observed, under the assumption that the null hypothesis is correct. A lower p-value means fewer chances for our observed result to happen. If our p-value is less than α , our null hypothesis is rejected, otherwise null hypothesis is accepted.
Types of Hypothesis Tests
Since we are equipped with the basic terms, let’s go ahead and conduct some hypothesis tests.
Conducting a Two-Tailed Hypothesis Test
In a two-tailed hypothesis test, our analysis can go in either direction i.e. either more than or less than our observed value. For example, a medical researcher testing out the effects of a placebo wants to know whether it increases or decreases blood pressure. Let’s look at its Python implementation.
In the above code, we want to know if the group study method is an effective way to study or not. Therefore our null and alternate hypotheses are as follows.
- H 0 : The Group study method is not an effective way to study .
- H a : The group study method is an effective way to study .

Since the p-value is greater than α , we fail to reject the null hypothesis. Therefore the group study method is not an effective way to study.
Recommended: Hypothesis Testing in Python: Finding the critical value of T
In a one-tailed hypothesis test, we have certain expectations in which way our observed value will move i.e. higher or lower. For example, our researchers want to know if a particular medicine lowers our cholesterol level. Let’s look at its Python code.
Here our null and alternate hypothesis tests are given below.
- H 0 : The Group study method does not increase our marks.
- H a : The group study method increases our marks.

Since the p-value is greater than α , we fail to reject the null hypothesis. Therefore the group study method does not increase our marks.
A paired sample test compares two sets of observations and then provides us with a conclusion. For example, we need to know whether the reaction time of our participants increases after consuming caffeine. Let’s look at another example with a Python code as well.
Similar to the above hypothesis tests, we consider the group study method here as well. Our null and alternate hypotheses are as follows.
- H 0 : The group study method does not provide us with significant differences in our scores.
- H a : The group study method gives us significant differences in our scores.

Since the p-value is greater than α , we fail to reject the null hypothesis.
Here you go! Now you are equipped to perform statistical hypothesis testing on different samples and draw out different conclusions. You need to collect data and decide on null and alternate hypotheses. Furthermore, based on the predetermined hypothesis, you need to decide on which type of test to perform. Statistical hypothesis testing is one of the most powerful tools in the world of research.
Now that you have a grasp on statistical hypothesis testing, how will you apply these concepts to your own research or data analysis projects? What hypotheses are you eager to test?
Do check out: How to find critical value in Python
Python Companion to Statistical Thinking in the 21st Century
Hypothesis testing in Python
Hypothesis testing in python #.
In this chapter we will present several examples of using Python to perform hypothesis testing.
Simple example: Coin-flipping #
Let’s say that we flipped 100 coins and observed 70 heads. We would like to use these data to test the hypothesis that the true probability is 0.5. First let’s generate our data, simulating 100,000 sets of 100 flips. We use such a large number because it turns out that it’s very rare to get 70 heads, so we need many attempts in order to get a reliable estimate of these probabilties. This will take a couple of minutes to complete.
Now we can compute the proportion of samples from the distribution observed when the true proportion of heads is 0.5.
For comparison, we can also compute the p-value for 70 or more heads based on a null hypothesis of \(P_{heads}=0.5\) , using the binomial distribution.
compute the probability of 69 or fewer heads, when P(heads)=0.5
the probability of 70 or more heads is simply the complement of p_lt_70
Simulating p-values #
In this exercise we will perform hypothesis testing many times in order to test whether the p-values provided by our statistical test are valid. We will sample data from a normal distribution with a mean of zero, and for each sample perform a t-test to determine whether the mean is different from zero. We will then count how often we reject the null hypothesis; since we know that the true mean is zero, these are by definition Type I errors.
We should see that the proportion of samples with p < .05 is about 5%.
Adventures in Machine Learning
Mastering hypothesis testing in python: a step-by-step guide.
Hypothesis Testing in Python: AnHypothesis testing is a statistical technique that allows us to draw conclusions about a population based on a sample of data. It is often used in fields like medicine, psychology, and economics to test the effectiveness of new treatments, analyze consumer behavior, or estimate the impact of policy changes.
In Python, hypothesis testing is facilitated by modules such as scipy.stats and statsmodels.stats. In this article, we’ll explore three examples of hypothesis testing in Python: the one sample t-test, the two sample t-test, and the paired samples t-test.
For each test, we’ll provide a brief explanation of the underlying concepts, an example of a research question that can be answered using the test, and a step-by-step guide to performing the test in Python. Let’s get started!
One Sample t-test
The one sample t-test is used to compare a sample mean to a known or hypothesized population mean. This allows us to determine whether the sample mean is significantly different from the population mean.
The test assumes that the data are normally distributed and that the sample is randomly drawn from the population. Example research question: Is the mean weight of a species of turtle significantly different from a known or hypothesized value?
Step-by-step guide:
1. Define the null hypothesis (H0) and alternative hypothesis (Ha).
The null hypothesis is typically that the sample mean is equal to the population mean. The alternative hypothesis is that they are not equal.
For example:
H0: The mean weight of a species of turtle is 100 grams. Ha: The mean weight of a species of turtle is not 100 grams.
2. Collect a random sample of data.
This can be done using Python’s random module or by importing data from a file. For example:
weight_sample = [95, 105, 110, 98, 102, 116, 101, 99, 104, 108]
Calculate the sample mean (x), sample standard deviation (s), and standard error (SE). For example:
x = sum(weight_sample)/len(weight_sample)
s = np.std(weight_sample)
SE = s / (len(weight_sample)**0.5)
Calculate the t-value using the formula: t = (x – ) / (SE), where is the hypothesized population mean. For example:
t = (x – 100) / SE
Calculate the p-value using a t-distribution table or a Python function like scipy.stats.ttest_1samp(). For example:
p_value = scipy.stats.ttest_1samp(weight_sample, 100).pvalue
Compare the p-value to the level of significance (), typically set to 0.05. If the p-value is less than , reject the null hypothesis and conclude that there is sufficient evidence to support the alternative hypothesis.
If the p-value is greater than , fail to reject the null hypothesis and conclude that there is insufficient evidence to support the alternative hypothesis. For example:
if p_value < 0.05:
print(“Reject the null hypothesis.”)
print(“Fail to reject the null hypothesis.”)
Two Sample t-test
The two sample t-test is used to compare the means of two independent samples. This allows us to determine whether the means are significantly different from each other.
The test assumes that the data are normally distributed and that the samples are randomly drawn from their respective populations. Example research question: Is the mean weight of two different species of turtles significantly different from each other?
The null hypothesis is typically that the sample means are equal. The alternative hypothesis is that they are not equal.
H0: The mean weight of species A is equal to the mean weight of species B. Ha: The mean weight of species A is not equal to the mean weight of species B.
2. Collect two random samples of data.
species_a = [95, 105, 110, 98, 102]
species_b = [116, 101, 99, 104, 108]
Calculate the sample means (x1, x2), sample standard deviations (s1, s2), and pooled standard error (SE). For example:
x1 = sum(species_a)/len(species_a)
x2 = sum(species_b)/len(species_b)
s1 = np.std(species_a)
s2 = np.std(species_b)
n1 = len(species_a)
n2 = len(species_b)
SE = (((n1-1)*s1**2 + (n2-1)*s2**2)/(n1+n2-2))**0.5 * (1/n1 + 1/n2)**0.5
Calculate the t-value using the formula: t = (x1 – x2) / (SE), where x1 and x2 are the sample means. For example:
t = (x1 – x2) / SE
Calculate the p-value using a t-distribution table or a Python function like scipy.stats.ttest_ind(). For example:
p_value = scipy.stats.ttest_ind(species_a, species_b).pvalue
Paired Samples t-test
The paired samples t-test is used to compare the means of two related samples. This allows us to determine whether the means are significantly different from each other, while accounting for individual differences between the samples.
The test assumes that the differences between paired observations are normally distributed. Example research question: Is there a significant difference in the max vertical jump of basketball players before and after a training program?
The null hypothesis is typically that the mean difference is equal to zero. The alternative hypothesis is that it is not equal to zero.
H0: The mean difference in max vertical jump before and after training is zero. Ha: The mean difference in max vertical jump before and after training is not zero.
2. Collect two related samples of data.
This can be done by measuring the same variable in the same subjects before and after a treatment or intervention. For example:
before = [72, 69, 77, 71, 76]
after = [80, 70, 75, 74, 78]
Calculate the differences between the paired observations and the sample mean difference (d), sample standard deviation (s), and standard error (SE). For example:
differences = [after[i]-before[i] for i in range(len(before))]
d = sum(differences)/len(differences)
s = np.std(differences)
SE = s / (len(differences)**0.5)
Calculate the t-value using the formula: t = (d – ) / (SE), where is the hypothesized population mean difference (usually zero). For example:
t = (d – 0) / SE
Calculate the p-value using a t-distribution table or a Python function like scipy.stats.ttest_rel(). For example:
p_value = scipy.stats.ttest_rel(after, before).pvalue
In this article, we’ve explored three examples of hypothesis testing in Python: the one sample t-test, the two sample t-test, and the paired samples t-test. Hypothesis testing is a powerful tool for making inferences about populations based on samples of data.
By following the steps outlined in each example, you can conduct your own hypothesis tests in Python and draw meaningful conclusions from your data.
Two Sample t-test in Python
The two sample t-test is used to compare two independent samples and determine if there is a significant difference between the means of the two populations. In this test, the null hypothesis is that the means of the two samples are equal, while the alternative hypothesis is that they are not equal.
Example research question: Is the mean weight of two different species of turtles significantly different from each other? Step-by-step guide:
Define the null hypothesis (H0) and alternative hypothesis (Ha). The null hypothesis is that the mean weight of the two turtle species is the same.
The alternative hypothesis is that they are not equal. For example:
H0: The mean weight of species A is equal to the mean weight of species B.
Ha: The mean weight of species A is not equal to the mean weight of species B. 2.
Collect a random sample of data for each species. For example:
species_a = [4.3, 3.9, 5.1, 4.6, 4.2, 4.8]
species_b = [4.9, 5.2, 5.5, 5.3, 5.0, 4.7]
Calculate the sample mean (x1, x2), sample standard deviation (s1, s2), and pooled standard error (SE). For example:
import numpy as np
from scipy.stats import ttest_ind
x1 = np.mean(species_a)
x2 = np.mean(species_b)
SE = np.sqrt(s1**2/n1 + s2**2/n2)
4. Calculate the t-value using the formula: t = (x1 – x2) / (SE), where x1 and x2 are the sample means.
5. Calculate the p-value using a t-distribution table or a Python function like ttest_ind().
p_value = ttest_ind(species_a, species_b).pvalue
6. Compare the p-value to the level of significance (), typically set to 0.05.
If the p-value is less than , reject the null hypothesis and conclude that there is sufficient evidence to support the alternative hypothesis. If the p-value is greater than , fail to reject the null hypothesis and conclude that there is insufficient evidence to support the alternative hypothesis.
alpha = 0.05
if p_value < alpha:
In this example, if the p-value is less than 0.05, we would reject the null hypothesis and conclude that there is a significant difference between the mean weight of the two turtle species.
Paired Samples t-test in Python
The paired samples t-test is used to compare the means of two related samples. In this test, the null hypothesis is that the difference between the two means is equal to zero, while the alternative hypothesis is that they are not equal.
Example research question: Is there a significant difference in the max vertical jump of basketball players before and after a training program? Step-by-step guide:
Define the null hypothesis (H0) and alternative hypothesis (Ha). The null hypothesis is that the mean difference in max vertical jump before and after the training program is zero.
The alternative hypothesis is that it is not zero. For example:
H0: The mean difference in max vertical jump before and after the training program is zero.
Ha: The mean difference in max vertical jump before and after the training program is not zero. 2.
Collect two related samples of data, such as the max vertical jump of basketball players before and after a training program. For example:
before_training = [58, 64, 62, 70, 68]
after_training = [62, 66, 64, 74, 70]
differences = [after_training[i]-before_training[i] for i in range(len(before_training))]
d = np.mean(differences)
n = len(differences)
SE = s / np.sqrt(n)
Calculate the p-value using a t-distribution table or a Python function like ttest_rel(). For example:
p_value = ttest_rel(after_training, before_training).pvalue
In this example, if the p-value is less than 0.05, we would reject the null hypothesis and conclude that there is a significant difference in the max vertical jump of basketball players before and after the training program.
Hypothesis testing is an essential tool in statistical analysis, which gives us insights into populations based on limited data. The two sample t-test and paired samples t-test are two popular statistical methods that enable researchers to compare means of samples and determine whether they are significantly different.
With the help of Python, hypothesis testing in practice is made more accessible and convenient than ever before. In this article, we have provided a step-by-step guide to performing these tests in Python, enabling researchers to perform rigorous analyses that generate meaningful and accurate results.
In conclusion, hypothesis testing in Python is a crucial step in making conclusions about populations based on data samples. The three common hypothesis tests in Python; one-sample t-test, two-sample t-test, and paired samples t-test can be effectively applied to explore various research questions.
By setting null and alternative hypotheses, collecting data, calculating mean and standard deviation values, computing t-value, and comparing it with the set significance level of , we can determine if there’s enough evidence to reject the null hypothesis. With the use of such powerful methods, scientists can give more accurate and informed conclusions to real-world problems and take critical decisions when needed.
Continual learning and expertise with hypothesis testing in Python tools can enable researchers to leverage this powerful statistical tool for better outcomes.
Popular Posts
Mastering wxpython: building functional desktop applications, mastering user input boolean values in python, handling math domain error: dealing with negative inputs in sqrt() and log() functions.
- Terms & Conditions
- Privacy Policy
What Is Hypothesis Testing? Types and Python Code Example

Curiosity has always been a part of human nature. Since the beginning of time, this has been one of the most important tools for birthing civilizations. Still, our curiosity grows — it tests and expands our limits. Humanity has explored the plains of land, water, and air. We've built underwater habitats where we could live for weeks. Our civilization has explored various planets. We've explored land to an unlimited degree.
These things were possible because humans asked questions and searched until they found answers. However, for us to get these answers, a proven method must be used and followed through to validate our results. Historically, philosophers assumed the earth was flat and you would fall off when you reached the edge. While philosophers like Aristotle argued that the earth was spherical based on the formation of the stars, they could not prove it at the time.
This is because they didn't have adequate resources to explore space or mathematically prove Earth's shape. It was a Greek mathematician named Eratosthenes who calculated the earth's circumference with incredible precision. He used scientific methods to show that the Earth was not flat. Since then, other methods have been used to prove the Earth's spherical shape.
When there are questions or statements that are yet to be tested and confirmed based on some scientific method, they are called hypotheses. Basically, we have two types of hypotheses: null and alternate.
A null hypothesis is one's default belief or argument about a subject matter. In the case of the earth's shape, the null hypothesis was that the earth was flat.
An alternate hypothesis is a belief or argument a person might try to establish. Aristotle and Eratosthenes argued that the earth was spherical.
Other examples of a random alternate hypothesis include:
- The weather may have an impact on a person's mood.
- More people wear suits on Mondays compared to other days of the week.
- Children are more likely to be brilliant if both parents are in academia, and so on.
Hypothesis testing is the act of testing whether a hypothesis or inference is true. When an alternate hypothesis is introduced, we test it against the null hypothesis to know which is correct. Let's use a plant experiment by a 12-year-old student to see how this works.
The hypothesis is that a plant will grow taller when given a certain type of fertilizer. The student takes two samples of the same plant, fertilizes one, and leaves the other unfertilized. He measures the plants' height every few days and records the results in a table.
After a week or two, he compares the final height of both plants to see which grew taller. If the plant given fertilizer grew taller, the hypothesis is established as fact. If not, the hypothesis is not supported. This simple experiment shows how to form a hypothesis, test it experimentally, and analyze the results.
In hypothesis testing, there are two types of error: Type I and Type II.
When we reject the null hypothesis in a case where it is correct, we've committed a Type I error. Type II errors occur when we fail to reject the null hypothesis when it is incorrect.
In our plant experiment above, if the student finds out that both plants' heights are the same at the end of the test period yet opines that fertilizer helps with plant growth, he has committed a Type I error.
However, if the fertilized plant comes out taller and the student records that both plants are the same or that the one without fertilizer grew taller, he has committed a Type II error because he has failed to reject the null hypothesis.
What are the Steps in Hypothesis Testing?
The following steps explain how we can test a hypothesis:
Step #1 - Define the Null and Alternative Hypotheses
Before making any test, we must first define what we are testing and what the default assumption is about the subject. In this article, we'll be testing if the average weight of 10-year-old children is more than 32kg.
Our null hypothesis is that 10 year old children weigh 32 kg on average. Our alternate hypothesis is that the average weight is more than 32kg. Ho denotes a null hypothesis, while H1 denotes an alternate hypothesis.
Step #2 - Choose a Significance Level
The significance level is a threshold for determining if the test is valid. It gives credibility to our hypothesis test to ensure we are not just luck-dependent but have enough evidence to support our claims. We usually set our significance level before conducting our tests. The criterion for determining our significance value is known as p-value.
A lower p-value means that there is stronger evidence against the null hypothesis, and therefore, a greater degree of significance. A p-value of 0.05 is widely accepted to be significant in most fields of science. P-values do not denote the probability of the outcome of the result, they just serve as a benchmark for determining whether our test result is due to chance. For our test, our p-value will be 0.05.
Step #3 - Collect Data and Calculate a Test Statistic
You can obtain your data from online data stores or conduct your research directly. Data can be scraped or researched online. The methodology might depend on the research you are trying to conduct.
We can calculate our test using any of the appropriate hypothesis tests. This can be a T-test, Z-test, Chi-squared, and so on. There are several hypothesis tests, each suiting different purposes and research questions. In this article, we'll use the T-test to run our hypothesis, but I'll explain the Z-test, and chi-squared too.
T-test is used for comparison of two sets of data when we don't know the population standard deviation. It's a parametric test, meaning it makes assumptions about the distribution of the data. These assumptions include that the data is normally distributed and that the variances of the two groups are equal. In a more simple and practical sense, imagine that we have test scores in a class for males and females, but we don't know how different or similar these scores are. We can use a t-test to see if there's a real difference.
The Z-test is used for comparison between two sets of data when the population standard deviation is known. It is also a parametric test, but it makes fewer assumptions about the distribution of data. The z-test assumes that the data is normally distributed, but it does not assume that the variances of the two groups are equal. In our class test example, with the t-test, we can say that if we already know how spread out the scores are in both groups, we can now use the z-test to see if there's a difference in the average scores.
The Chi-squared test is used to compare two or more categorical variables. The chi-squared test is a non-parametric test, meaning it does not make any assumptions about the distribution of data. It can be used to test a variety of hypotheses, including whether two or more groups have equal proportions.
Step #4 - Decide on the Null Hypothesis Based on the Test Statistic and Significance Level
After conducting our test and calculating the test statistic, we can compare its value to the predetermined significance level. If the test statistic falls beyond the significance level, we can decide to reject the null hypothesis, indicating that there is sufficient evidence to support our alternative hypothesis.
On the other contrary, if the test statistic does not exceed the significance level, we fail to reject the null hypothesis, signifying that we do not have enough statistical evidence to conclude in favor of the alternative hypothesis.
Step #5 - Interpret the Results
Depending on the decision made in the previous step, we can interpret the result in the context of our study and the practical implications. For our case study, we can interpret whether we have significant evidence to support our claim that the average weight of 10 year old children is more than 32kg or not.
For our test, we are generating random dummy data for the weight of the children. We'll use a t-test to evaluate whether our hypothesis is correct or not.
For a better understanding, let's look at what each block of code does.
The first block is the import statement, where we import numpy and scipy.stats . Numpy is a Python library used for scientific computing. It has a large library of functions for working with arrays. Scipy is a library for mathematical functions. It has a stat module for performing statistical functions, and that's what we'll be using for our t-test.
The weights of the children were generated at random since we aren't working with an actual dataset. The random module within the Numpy library provides a function for generating random numbers, which is randint .
The randint function takes three arguments. The first (20) is the lower bound of the random numbers to be generated. The second (40) is the upper bound, and the third (100) specifies the number of random integers to generate. That is, we are generating random weight values for 100 children. In real circumstances, these weight samples would have been obtained by taking the weight of the required number of children needed for the test.
Using the code above, we declared our null and alternate hypotheses stating the average weight of a 10-year-old in both cases.
t_stat and p_value are the variables in which we'll store the results of our functions. stats.ttest_1samp is the function that calculates our test. It takes in two variables, the first is the data variable that stores the array of weights for children, and the second (32) is the value against which we'll test the mean of our array of weights or dataset in cases where we are using a real-world dataset.
The code above prints both values for t_stats and p_value .
Lastly, we evaluated our p_value against our significance value, which is 0.05. If our p_value is less than 0.05, we reject the null hypothesis. Otherwise, we fail to reject the null hypothesis. Below is the output of this program. Our null hypothesis was rejected.
In this article, we discussed the importance of hypothesis testing. We highlighted how science has advanced human knowledge and civilization through formulating and testing hypotheses.
We discussed Type I and Type II errors in hypothesis testing and how they underscore the importance of careful consideration and analysis in scientific inquiry. It reinforces the idea that conclusions should be drawn based on thorough statistical analysis rather than assumptions or biases.
We also generated a sample dataset using the relevant Python libraries and used the needed functions to calculate and test our alternate hypothesis.
Thank you for reading! Please follow me on LinkedIn where I also post more data related content.
Technical support engineer with 4 years of experience & 6 months in data analytics. Passionate about data science, programming, & statistics.
If you read this far, thank the author to show them you care. Say Thanks
Learn to code for free. freeCodeCamp's open source curriculum has helped more than 40,000 people get jobs as developers. Get started
Statistical functions ( scipy.stats ) #
This module contains a large number of probability distributions, summary and frequency statistics, correlation functions and statistical tests, masked statistics, kernel density estimation, quasi-Monte Carlo functionality, and more.
Statistics is a very large area, and there are topics that are out of scope for SciPy and are covered by other packages. Some of the most important ones are:
statsmodels : regression, linear models, time series analysis, extensions to topics also covered by scipy.stats .
Pandas : tabular data, time series functionality, interfaces to other statistical languages.
PyMC : Bayesian statistical modeling, probabilistic machine learning.
scikit-learn : classification, regression, model selection.
Seaborn : statistical data visualization.
rpy2 : Python to R bridge.
Probability distributions #
Each univariate distribution is an instance of a subclass of rv_continuous ( rv_discrete for discrete distributions):
Continuous distributions #
The fit method of the univariate continuous distributions uses maximum likelihood estimation to fit the distribution to a data set. The fit method can accept regular data or censored data . Censored data is represented with instances of the CensoredData class.
Multivariate distributions #
scipy.stats.multivariate_normal methods accept instances of the following class to represent the covariance.
Discrete distributions #
An overview of statistical functions is given below. Many of these functions have a similar version in scipy.stats.mstats which work for masked arrays.
Summary statistics #
Frequency statistics #, hypothesis tests and related functions #.
SciPy has many functions for performing hypothesis tests that return a test statistic and a p-value, and several of them return confidence intervals and/or other related information.
The headings below are based on common uses of the functions within, but due to the wide variety of statistical procedures, any attempt at coarse-grained categorization will be imperfect. Also, note that tests within the same heading are not interchangeable in general (e.g. many have different distributional assumptions).
One Sample Tests / Paired Sample Tests #
One sample tests are typically used to assess whether a single sample was drawn from a specified distribution or a distribution with specified properties (e.g. zero mean).
Paired sample tests are often used to assess whether two samples were drawn from the same distribution; they differ from the independent sample tests below in that each observation in one sample is treated as paired with a closely-related observation in the other sample (e.g. when environmental factors are controlled between observations within a pair but not among pairs). They can also be interpreted or used as one-sample tests (e.g. tests on the mean or median of differences between paired observations).
Association/Correlation Tests #
These tests are often used to assess whether there is a relationship (e.g. linear) between paired observations in multiple samples or among the coordinates of multivariate observations.
These association tests and are to work with samples in the form of contingency tables. Supporting functions are available in scipy.stats.contingency .
Independent Sample Tests #
Independent sample tests are typically used to assess whether multiple samples were independently drawn from the same distribution or different distributions with a shared property (e.g. equal means).
Some tests are specifically for comparing two samples.
Others are generalized to multiple samples.
Resampling and Monte Carlo Methods #
The following functions can reproduce the p-value and confidence interval results of most of the functions above, and often produce accurate results in a wider variety of conditions. They can also be used to perform hypothesis tests and generate confidence intervals for custom statistics. This flexibility comes at the cost of greater computational requirements and stochastic results.
Instances of the following object can be passed into some hypothesis test functions to perform a resampling or Monte Carlo version of the hypothesis test.
Multiple Hypothesis Testing and Meta-Analysis #
These functions are for assessing the results of individual tests as a whole. Functions for performing specific multiple hypothesis tests (e.g. post hoc tests) are listed above.
The following functions are related to the tests above but do not belong in the above categories.
Quasi-Monte Carlo #
- scipy.stats.qmc.QMCEngine
- scipy.stats.qmc.Sobol
- scipy.stats.qmc.Halton
- scipy.stats.qmc.LatinHypercube
- scipy.stats.qmc.PoissonDisk
- scipy.stats.qmc.MultinomialQMC
- scipy.stats.qmc.MultivariateNormalQMC
- scipy.stats.qmc.discrepancy
- scipy.stats.qmc.geometric_discrepancy
- scipy.stats.qmc.update_discrepancy
- scipy.stats.qmc.scale
Contingency Tables #
- chi2_contingency
- relative_risk
- association
- expected_freq
Masked statistics functions #
- hdquantiles
- hdquantiles_sd
- idealfourths
- plotting_positions
- find_repeats
- trimmed_mean
- trimmed_mean_ci
- trimmed_std
- trimmed_var
- scoreatpercentile
- pointbiserialr
- kendalltau_seasonal
- siegelslopes
- theilslopes
- sen_seasonal_slopes
- ttest_1samp
- ttest_onesamp
- mannwhitneyu
- kruskalwallis
- friedmanchisquare
- brunnermunzel
- kurtosistest
- obrientransform
- trimmed_stde
- argstoarray
- count_tied_groups
- compare_medians_ms
- median_cihs
- mquantiles_cimj
Other statistical functionality #
Transformations #, statistical distances #.
- scipy.stats.sampling.NumericalInverseHermite
- scipy.stats.sampling.NumericalInversePolynomial
- scipy.stats.sampling.TransformedDensityRejection
- scipy.stats.sampling.SimpleRatioUniforms
- scipy.stats.sampling.RatioUniforms
- scipy.stats.sampling.DiscreteAliasUrn
- scipy.stats.sampling.DiscreteGuideTable
- scipy.stats.sampling.UNURANError
- FastGeneratorInversion
- scipy.stats.sampling.FastGeneratorInversion.evaluate_error
- scipy.stats.sampling.FastGeneratorInversion.ppf
- scipy.stats.sampling.FastGeneratorInversion.qrvs
- scipy.stats.sampling.FastGeneratorInversion.rvs
- scipy.stats.sampling.FastGeneratorInversion.support
Random variate generation / CDF Inversion #
Fitting / survival analysis #, directional statistical functions #, sensitivity analysis #, plot-tests #, univariate and multivariate kernel density estimation #, warnings / errors used in scipy.stats #, result classes used in scipy.stats #.
These classes are private, but they are included here because instances of them are returned by other statistical functions. User import and instantiation is not supported.
- scipy.stats._result_classes.RelativeRiskResult
- scipy.stats._result_classes.BinomTestResult
- scipy.stats._result_classes.TukeyHSDResult
- scipy.stats._result_classes.DunnettResult
- scipy.stats._result_classes.PearsonRResult
- scipy.stats._result_classes.FitResult
- scipy.stats._result_classes.OddsRatioResult
- scipy.stats._result_classes.TtestResult
- scipy.stats._result_classes.ECDFResult
- scipy.stats._result_classes.EmpiricalDistributionFunction

Example 1: One Sample t-test in Python. A one sample t-test is used to test whether or not the mean of a population is equal to some value. For example, suppose we want to know whether or not the mean weight of a certain species of some turtle is equal to 310 pounds. To test this, we go out and collect a simple random sample of turtles with the ...
In this post, you will discover a cheat sheet for the most popular statistical hypothesis tests for a machine learning project with examples using the Python API. Each statistical test is presented in a consistent way, including: The name of the test. What the test is checking. The key assumptions of the test.
At this point, hypothesis testing structures the problems so that we can use statistical evidence to test these claims. So we can check whether or not the claim is valid. In this article, I want to show hypothesis testing with Python on several questions step-by-step. But before, let me explain the hypothesis testing process briefly.
In this article, we interactively explore and visualize the difference between three common statistical tests: T-test, ANOVA test and Chi-Squared test. We also use examples to walkthrough essential steps in hypothesis testing: 1. define the null and alternative hypothesis. 2. choose the appropriate test.
Dive into the fascinating process of hypothesis testing with Python in this comprehensive guide. Perfect for aspiring data scientists and analytical minds, learn how to validate your predictions using statistical tests and Python's robust libraries. From understanding the basics of hypothesis formulation to executing detailed statistical analysis, this article illuminates the path to data ...
12. Hypothesis Testing — Learning Statistics with Python. 12. Hypothesis Testing #. The process of induction is the process of assuming the simplest law that can be made to harmonize with our experience. This process, however, has no logical foundation but only a psychological one. It is clear that there are no grounds for believing that the ...
In this article, we are going to examine a case study of hypothesis testing on the seeds dataset, by using the Pingouin Python library. The Basic Steps of Hypothesis Testing. The first step in hypothesis testing is coming up with the research hypothesis, a statement that can be tested statistically and involves the comparison of variables, e.g ...
A statistical hypothesis test may return a value called p or the p-value. This is a quantity that we can use to interpret or quantify the result of the test and either reject or fail to reject the null hypothesis. This is done by comparing the p-value to a threshold value chosen beforehand called the significance level.
A hypothesis test is a method of statistical inference that allows us to make decisions about a population based on sample data. The process of hypothesis testing involves two hypotheses: the null ...
Hypothesis testing is used to address questions about a population based on a subset from that population. For example, A/B testing is a framework for learning about consumer behavior based on a small sample of consumers. This course assumes some preexisting knowledge of Python, including the NumPy and pandas libraries.
Statistical hypothesis testing allows researchers to make inferences about populations based on sample data. It involves setting up a null hypothesis, choosing a confidence level, calculating a p-value, and conducting tests such as two-tailed, one-tailed, or paired sample tests to draw conclusions. ... Recommended: Hypothesis Testing in Python ...
In this exercise we will perform hypothesis testing many times in order to test whether the p-values provided by our statistical test are valid. We will sample data from a normal distribution with a mean of zero, and for each sample perform a t-test to determine whether the mean is different from zero. We will then count how often we reject the ...
Hypothesis Testing in Python: AnHypothesis testing is a statistical technique that allows us to draw conclusions about a population based on a sample of data. It is often used in fields like medicine, psychology, and economics to test the effectiveness of new treatments, analyze consumer behavior, or estimate the impact of policy changes ...
To calculate the power of the test, we'll take the assumed mu and sigma with a 95% bounds (based on the assumption that the probability of the coin landing on heads is 0.5 or 50% - a fair coin). We'll determine the lower and upper bounds: lo, hi = normal_two_sided_bounds(0.95, mu_0, sigma_0) lo # 469.01026640487555.
Hypothesis testing is the act of testing whether a hypothesis or inference is true. When an alternate hypothesis is introduced, we test it against the null hypothesis to know which is correct. Let's use a plant experiment by a 12-year-old student to see how this works. The hypothesis is that a plant will grow taller when given a certain type of ...
Explore and run machine learning code with Kaggle Notebooks | Using data from multiple data sources
Statistical functions (. scipy.stats. ) #. This module contains a large number of probability distributions, summary and frequency statistics, correlation functions and statistical tests, masked statistics, kernel density estimation, quasi-Monte Carlo functionality, and more. Statistics is a very large area, and there are topics that are out of ...
Hypothesis Testing in Python. In this course, you'll learn advanced statistical concepts like significance testing and multi-category chi-square testing, which will help you perform more powerful and robust data analysis. Enroll for free. Part of the Data Analyst in Python, and Data Scientist paths. 4.8 (359 reviews)
The basis of hypothesis testing has two attributes: (a) Null Hypothesis and (b) Alternative Hypothesis. The null hypothesis is, in general, the boring stuff i.e. it assumes that nothing interesting happens/happened.. The alternative hypothesis is, where the action is i.e. some observation/ phenomenon is real (i.e. not a fluke) and statistical analysis will give us more insights on that.
For example, this is how you can test if a random sample is normally distributed using the Kolmogorov-Smirnov test: import numpy as np. from scipy.stats import norm, pareto, kstest. n = 1000. sample_norm = norm.rvs(size=1000) # generate normally distributed random sample. sample_pareto = pareto.rvs(1.0, size=1000) # sample from some other ...
Python code (such as a loop, if-statement, or Pandas statement used to retrieve data.) Student might be asked to evalauate a diagram, state a hypothesis, or interpret a t-test. The following is a list of items you should review to prepare for the exam. Note that not every item on
Now Let's see some of widely used hypothesis testing type :-T Test ( Student T test) Z Test; ANOVA Test; Chi-Square Test; T- Test :- A t-test is a type of inferential statistic which is used to determine if there is a significant difference between the means of two groups which may be related in certain features.It is mostly used when the data sets, like the set of data recorded as outcome ...
Introduction. In this excellent article, the author explores the p-value in statistics and uses the example of an archery team to compare two distributions.. I found this article very insightful but I was left wanting more in that I wanted the statistics breaking down into simple steps that a non-statistician could follow and I wanted to see the full python code that explored the datasets to ...
excel business plan financial template

Free Business Plan Excel Template [Excel Download]
Written by Dave Lavinsky
A business plan is a roadmap for growing your business. Not only does it help you plan out your venture, but it is required by funding sources like banks, venture capitalists and angel investors.
Download our Ultimate Business Plan Template here >
The body of your business plan describes your company and your strategies for growing it. The financial portion of your plan details the financial implications of your business: how much money you need, what you project your future sales and earnings to be, etc.
Below you will be able to download our free business plan excel template to help with the financial portion of your business plan. You will also learn about the importance of the financial model in your business plan.
Download the template here: Financial Plan Excel Template
How to Finish Your Business Plan in 1 Day!
Don’t you wish there was a faster, easier way to finish your business plan?
With Growthink’s Ultimate Business Plan Template you can finish your plan in just 8 hours or less! It includes a simple, plug-and-play financial model and a fill-in-the-blanks template for completing the body of your plan.
What’s Included in our Business Plan Excel Template
Our business plan excel template includes the following sections:
Income Statement : A projection of your business’ revenues, costs, and expenses over a specific period of time. Includes sections for sales revenue, cost of goods sold (COGS), operating expenses, and net profit or loss.
Example 5 Year Annual Income Statement
Cash Flow Statement : A projection of your business’ cash inflows and outflows over a specific period of time. Includes sections for cash inflows (such as sales receipts, loans, and investments), cash outflows (such as expenses, salaries, and loan repayments), and net cash flow.
Example 5 Year Annual Cash Flow Statement
Balance Sheet : A snapshot of your business’ financial position at a specific point in time. Includes sections for assets (such as cash, inventory, equipment, and property), liabilities (such as loans, accounts payable, and salaries payable), and owner’s equity (such as retained earnings and capital contributions).
Example 5 Year Annual Balance Sheet
Download the template here: Business Plan Excel Template
The template is easy to customize according to your specific business needs. Simply input your own financial data and projections, and use it as a guide to create a comprehensive financial plan for your business. Remember to review and update your financial plan regularly to track your progress and make informed financial decisions.
Finish Your Business Plan Today!
The importance of the financial model in your business plan.
A solid financial model is a critical component of any well-prepared business plan. It provides a comprehensive and detailed projection of your business’ financial performance, including revenue, expenses, cash flow, and profitability. The financial model is not just a mere set of numbers, but a strategic tool that helps you understand the financial health of your business, make informed decisions, and communicate your business’ financial viability to potential investors, lenders, and other stakeholders. In this article, we will delve into the importance of the financial model in your business plan.
- Provides a roadmap for financial success : A well-structured financial model serves as a roadmap for your business’ financial success. It outlines your revenue streams, cost structure, and cash flow projections, helping you understand the financial implications of your business strategies and decisions. It allows you to forecast your future financial performance, set financial goals, and measure your progress over time. A comprehensive financial model helps you identify potential risks, opportunities, and areas that may require adjustments to achieve your financial objectives.
- Demonstrates financial viability to stakeholders : Investors, lenders, and other stakeholders want to see that your business is financially viable and has a plan to generate revenue, manage expenses, and generate profits. A robust financial model in your business plan demonstrates that you have a solid understanding of your business’ financials and have a plan to achieve profitability. It provides evidence of the market opportunity, pricing strategy, sales projections, and financial sustainability. A well-prepared financial model increases your credibility and instills confidence in your business among potential investors and lenders.
- Helps with financial decision-making : Your financial model is a valuable tool for making informed financial decisions. It helps you analyze different scenarios, evaluate the financial impact of your decisions, and choose the best course of action for your business. For example, you can use your financial model to assess the feasibility of a new product launch, determine the optimal pricing strategy, or evaluate the impact of changing market conditions on your cash flow. A well-structured financial model helps you make data-driven decisions that are aligned with your business goals and financial objectives.
- Assists in securing funding : If you are seeking funding from investors or lenders, a robust financial model is essential. It provides a clear picture of your business’ financials and shows how the funds will be used to generate revenue and profits. It includes projections for revenue, expenses, cash flow, and profitability, along with a breakdown of assumptions and methodology used. It also provides a realistic assessment of the risks and challenges associated with your business and outlines the strategies to mitigate them. A well-prepared financial model in your business plan can significantly increase your chances of securing funding as it demonstrates your business’ financial viability and growth potential.
- Facilitates financial management and monitoring : A financial model is not just for external stakeholders; it is also a valuable tool for internal financial management and monitoring. It helps you track your actual financial performance against your projections, identify any deviations, and take corrective actions if needed. It provides a clear overview of your business’ cash flow, profitability, and financial health, allowing you to proactively manage your finances and make informed decisions to achieve your financial goals. A well-structured financial model helps you stay on top of your business’ financials and enables you to take timely actions to ensure your business’ financial success.
- Enhances business valuation : If you are planning to sell your business or seek investors for an exit strategy, a robust financial model is crucial. It provides a solid foundation for business valuation as it outlines your historical financial performance, future projections, and the assumptions behind them. It helps potential buyers or investors understand the financial potential of your business and assess its value. A well-prepared financial model can significantly impact the valuation of your business, and a higher valuation can lead to better negotiation terms and higher returns on your investment.
- Supports strategic planning : Your financial model is an integral part of your strategic planning process. It helps you align your financial goals with your overall business strategy and provides insights into the financial feasibility of your strategic initiatives. For example, if you are planning to expand your business, enter new markets, or invest in new technologies, your financial model can help you assess the financial impact of these initiatives, including the investment required, the expected return on investment, and the timeline for achieving profitability. It enables you to make informed decisions about the strategic direction of your business and ensures that your financial goals are aligned with your overall business objectives.
- Enhances accountability and transparency : A robust financial model promotes accountability and transparency in your business. It provides a clear framework for setting financial targets, measuring performance, and holding yourself and your team accountable for achieving financial results. It helps you monitor your progress towards your financial goals and enables you to take corrective actions if needed. A well-structured financial model also enhances transparency by providing a clear overview of your business’ financials, assumptions, and methodologies used in your projections. It ensures that all stakeholders, including investors, lenders, employees, and partners, have a clear understanding of your business’ financial performance and prospects.
In conclusion, a well-prepared financial model is a crucial component of your business plan. It provides a roadmap for financial success, demonstrates financial viability to stakeholders, helps with financial decision-making, assists in securing funding, facilitates financial management and monitoring, enhances business valuation, supports strategic planning, and enhances accountability and transparency in your business. It is not just a set of numbers, but a strategic tool that helps you understand, analyze, and optimize your business’ financial performance. Investing time and effort in creating a comprehensive and robust financial model in your business plan is vital for the success of your business and can significantly increase your chances of achieving your financial goals.

Filter by Keywords
10 Free Business Plan Templates in Word, Excel, & ClickUp
Praburam Srinivasan
Growth Marketing Manager
February 13, 2024
Turning your vision into a clear and coherent business plan can be confusing and tough.
Hours of brainstorming and facing an intimidating blank page can raise more questions than answers. Are you covering everything? What should go where? How do you keep each section thorough but brief?
If these questions have kept you up at night and slowed your progress, know you’re not alone. That’s why we’ve put together the top 10 business plan templates in Word, Excel, and ClickUp—to provide answers, clarity, and a structured framework to work with. This way, you’re sure to capture all the relevant information without wasting time.
And the best part? Business planning becomes a little less “ugh!” and a lot more “aha!” 🤩
What is a Business Plan Template?
What makes a good business plan template, 1. clickup business plan template, 2. clickup sales plan template, 3. clickup business development action plan template, 4. clickup business roadmap template, 5. clickup business continuity plan template, 6. clickup lean business plan template, 7. clickup small business action plan template, 8. clickup strategic business roadmap template , 9. microsoft word business plan template by microsoft, 10. excel business plan template by vertex42.
A business plan template is a structured framework for entrepreneurs and business executives who want to create business plans. It comes with pre-arranged sections and headings that cover key elements like the executive summary , business overview, target customers, unique value proposition, marketing plans, and financial statements.
A good business plan template helps with thorough planning, clear documentation, and practical implementation. Here’s what to look for:
- Comprehensive structure: A good template comes with all the relevant sections to outline a business strategy, such as executive summary, market research and analysis, and financial projections
- Clarity and guidance: A good template is easy to follow. It has brief instructions or prompts for each section, guiding you to think deeply about your business and ensuring you don’t skip important details
- Clean design: Aesthetics matter. Choose a template that’s not just functional but also professionally designed. This ensures your plan is presentable to stakeholders, partners, and potential investors
- Flexibility : Your template should easily accommodate changes without hassle, like adding or removing sections, changing content and style, and rearranging parts 🛠️
While a template provides the structure, it’s the information you feed it that brings it to life. These pointers will help you pick a template that aligns with your business needs and clearly showcases your vision.
10 Business Plan Templates to Use in 2024
Preparing for business success in 2024 (and beyond) requires a comprehensive and organized business plan. We’ve handpicked the best templates to help you guide your team, attract investors, and secure funding. Let’s check them out.
If you’re looking to replace a traditional business plan document, then ClickUp’s Business Plan Template is for you!
This one-page business plan template, designed in ClickUp Docs , is neatly broken down into the following sections:
- Company description : Overview, mission, vision, and team
- Market analysis : Problem, solution, target market, competition, and competitive advantage
- Sales and marketing strategy : Products/services and marketing channels
- Operational plan : Location and facilities, equipment and tools, manpower, and financial forecasts
- Milestones and metrics: Targets and KPIs
Customize the template with your company logo and contact details, and easily navigate to different sections using the collapsible table of contents. The mini prompts under each section guide you on what to include—with suggestions on how to present the data (e.g., bullet lists, pictures, charts, and tables).
You can share the document with anyone via URL and collaborate in real time. And when the business plan is ready, you have the option to print it or export it to PDF, HTML, or Markdown.
But that’s not all. This template is equipped with basic and enterprise project management features to streamline the business plan creation process . The Topics List view has a list of all the different sections and subsections of the template and allows you to assign it to a team member, set a due date, and attach relevant documents and references.
Switch from List to Board view to track and update task statuses according to the following: To Do, In Progress, Needs Revision, and Complete.
This template is a comprehensive toolkit for documenting the different sections of your business plan and streamlining the creation process to ensure it’s completed on time. 🗓️
If you’re looking for a tool to kickstart or update your sales plan, ClickUp’s Sales Plan Template has got you covered. This sales plan template features a project summary list with tasks to help you craft a comprehensive and effective sales strategy. Some of these tasks include:
- Determine sales objectives and goals
- Draft positioning statement
- Perform competitive analysis
- Draft ideal customer persona
- Create a lead generation strategy
Assign each task to a specific individual or team, set priority levels , and add due dates. Specify what section of the sales plan each task belongs to (e.g., executive summary, revenue goals, team structure, etc.), deliverable type (such as document, task, or meeting), and approval state (like pending, needs revisions, and approved).
And in ClickUp style, you can switch to multiple views: List for a list of all tasks, Board for visual task management, Timeline for an overview of task durations, and Gantt to get a view of task dependencies.
This simple business plan template is perfect for any type of business looking to create a winning sales strategy while clarifying team roles and keeping tasks organized. ✨
Thinking about scaling your business’s reach and operations but unsure where or how to start? It can be overwhelming, no doubt—you need a clear vision, measurable goals, and an actionable plan that every member of your team can rally behind.
Thankfully, ClickUp’s Business Development Action Plan Template is designed to use automations to simplify this process so every step toward your business growth is clear, trackable, and actionable.
Start by assessing your current situation and deciding on your main growth goal. Are you aiming to increase revenue, tap into new markets, or introduce new products or services? With ClickUp Whiteboards or Docs, brainstorm and collaborate with your team on this decision.
Set and track your short- and long-term growth goals with ClickUp’s Goals , break them down into smaller targets, and assign these targets to team members, complete with due dates. Add these targets to a new ClickUp Dashboard to track real-time progress and celebrate small wins. 🎉
Whether you’re a startup or small business owner looking to hit your next major milestone or an established business exploring new avenues, this template keeps your team aligned, engaged, and informed every step of the way.
ClickUp’s Business Roadmap Template is your go-to for mapping out major strategies and initiatives in areas like revenue growth, brand awareness, community engagement, and customer satisfaction.
Use the List view to populate tasks under each initiative. With Custom Fields, you can capture which business category (e.g., Product, Operations, Sales & Marketing, etc.) tasks fall under and which quarter they’re slated for. You can also link to relevant documents and resources and evaluate tasks by effort and impact to ensure the most critical tasks get the attention they deserve. 👀
Depending on your focus, this template provides different views to show just what you need. For example, the All Initiatives per Quarter view lets you focus on what’s ahead by seeing tasks that need completion within a specific quarter. This ensures timely execution and helps in aligning resources effectively for the short term.
This template is ideal for business executives and management teams who need to coordinate multiple short- and long-term initiatives and business strategies.

In business, unexpected threats to operations can arise at any moment. Whether it’s economic turbulence, a global health crisis, or supply chain interruptions, every company needs to be ready. ClickUp’s Business Continuity Plan Template lets you prepare proactively for these unforeseen challenges.
The template organizes tasks into three main categories:
- Priorities: Tasks that need immediate attention
- Continuity coverage: Tasks that must continue despite challenges
- Guiding principles: Resources and protocols to ensure smooth operations
The Board view makes it easy to visualize all the tasks under each of these categories. And the Priorities List sorts tasks by those that are overdue, the upcoming ones, and then the ones due later.
In times of uncertainty, being prepared is your best strategy. This template helps your business not just survive but thrive in challenging situations, keeping your customers, employees, and investors satisfied. 🤝
Looking to execute your business plan the “lean” way? Use ClickUp’s Lean Business Plan Template . It’s designed to help you optimize resource usage and cut unnecessary steps—giving you better results with less effort.
In the Plan Summary List view, list all the tasks that need to get done. Add specific details like who’s doing each task, when it’s due, and which part of the Business Model Canvas (BMC) it falls under. The By Priority view sorts this list based on priorities like Urgent, High, Normal, and Low. This makes it easy to spot the most important tasks and tackle them first.
Additionally, the Board view gives you an overview of task progression from start to finish. And the BMC view rearranges these tasks based on the various BMC components.
Each task can further be broken down into subtasks and multiple checklists to ensure all related action items are executed. ✔️
This template is an invaluable resource for startups and large enterprises looking to maximize process efficiencies and results in a streamlined and cost-effective way.
The Small Business Action Plan Template by ClickUp is tailor-made for small businesses looking to transform their business ideas and goals into actionable steps and, eventually, into reality.
It provides a simple and organized framework for creating, assigning, prioritizing, and tracking tasks. And in effect, it ensures that goals are not just set but achieved. Through the native dashboard and goal-setting features, you can monitor task progress and how they move you closer to achieving your goals.
Thanks to ClickUp’s robust communication features like chat, comments, and @mentions, it’s easy to get every team member on the same page and quickly address questions or concerns.
Use this action plan template to hit your business goals by streamlining your internal processes and aligning team efforts.
For larger businesses and scaling enterprises, getting different departments to work together toward a big goal can be challenging. The ClickUp Strategic Business Roadmap Template makes it easier by giving you a clear plan to follow.
This template is packaged in a folder and split into different lists for each department in your business, like Sales, Product, Marketing, and Enablement. This way, every team can focus on their tasks while collectively contributing to the bigger goal.
There are multiple viewing options available for team members. These include:
- Progress Board: Visualize tasks that are on track, those at risk, and those behind
- Gantt view: Get an overview of project timelines and dependencies
- Team view: See what each team member is working on so you can balance workloads for maximum productivity
While this template may feel overwhelming at first, the getting started guide offers a step-by-step breakdown to help you navigate it with ease. And like all ClickUp templates, you can easily customize it to suit your business needs and preferences.
Microsoft’s 20-page traditional business plan template simplifies the process of drafting comprehensive business plans. It’s made up of different sections, including:
- Executive summary : Highlights, objectives, mission statement, and keys to success
- Description of business: Company ownership and legal structure, hours of operation, products and services, suppliers, financial plans, etc.
- Marketing: Market analysis, market segmentation, competition, and pricing
- Appendix: Start-up expenses, cash flow statements, income statements, sales forecast, milestones, break-even analysis, etc.
The table of contents makes it easy to move to different sections of the document. And the text placeholders under each section provide clarity on the specific details required—making the process easier for users who may not be familiar with certain business terminology.
No business template roundup is complete without an Excel template. This business plan template lets you work on your business financials in Excel. It comes with customizable tables, formulas, and charts to help you look at the following areas:
- Highlight charts
- Market analysis
- Start-up assets and expenses
- Sales forecasts
Profit and loss
- Balance sheet
- Cash flow projections
- Break-even analysis
This Excel template is especially useful when you want to create a clear and visual financial section for your business plan document—an essential element for attracting investors and lenders. However, there might be a steep learning curve to using this template if you’re not familiar with business financial planning and using Excel.
Try a Free Business Plan Template in ClickUp
Launching and running a successful business requires a well-thought-out and carefully crafted business plan. However, the business planning process doesn’t have to be complicated, boring, or take up too much time. Use any of the above 10 free business plan formats to simplify and speed up the process.
ClickUp templates go beyond offering a solid foundation to build your business plans. They come with extensive project management features to turn your vision into reality. And that’s not all— ClickUp’s template library offers over 1,000 additional templates to help manage various aspects of your business, from decision-making to product development to resource management .
Sign up for ClickUp’s Free Forever Plan today to fast-track your business’s growth! 🏆
Questions? Comments? Visit our Help Center for support.
Receive the latest WriteClick Newsletter updates.
Thanks for subscribing to our blog!
Please enter a valid email
- Free training & 24-hour support
- Serious about security & privacy
- 99.99% uptime the last 12 months

Professor Excel
Let's excel in Excel
Business Plan: How to Create Great Financial Plans in Excel

I guess, you are about to write a business plan and that is why you have come to this page. Very good – because in this article I am going to write down my experience with business plans and what I have learned creating them with Microsoft Excel. As I will point out again further down, I will only concentrate on the financial part of business plans. Specifically, how to set it up in Excel. Of course, you can also download an Excel template .
Parts of business plans
As you reached this page I suppose you already have a rough idea of what a business plan is. So, we will skip this part here.
A business plan is a formal written document containing the goals of a business, the methods for attaining those goals, and the time-frame for the achievement of the goals.” https://en.wikipedia.org/wiki/Business_plan

But one comment concerning the scope of this article: The formal business plan has usually many different parts, in which you describe the business idea and product, the market, competition, legal construct and so on. But typically, investors are most interested in the financial part. They want to know first, what they can get out of it. Of course, the other parts are also very important, but the financial topics usually put everything described in the other sections into numbers.
I’m not going further into the details of all the other parts than then financial section here. Specifically, we will dive into the basics of the financial part and how to model it in Excel.
Please scroll down to download the business plan template. We are going to explore all the following advice with this template.
How to create a business plan in Excel
Advice 1: be clear about the purpose and the recipient of the business plan.

Before you start opening Excel, make sure that you are 100% clear of the purpose this business plan. Is the business plan just for you? Or do you create it for someone else, for example an investor or bank? Although the next steps might still be the same, the focus might be different. For example: Maybe you have a very good understanding of the major assumptions because you have been working in this field for some time. But for someone external you still need to validate them. Of course, in both cases the assumptions should be realistic and goals should be achievable. But maybe for your own peace of mind you would choose more pessimistic assumptions if the plan was only for you.
Advice 2: Go top-down in terms of line items
Now, let’s start in Excel. But how do we start?
My approach is to go top-down. I usually use a basic P&L (“Profit- and loss” calculation) structure to start with, having some placeholders for revenue and costs.
Specifically, I go through the following parts (also shown on the right-hand side).
Let’s assume that you develop and sell Excel add-ins: 50 EUR per license – once-off. You would now start with assumptions of how many you can sell per month and the price. This is your first revenue item. At this point in time, I would leave it like this. We can later drill further down as much as we need (for example modeling discounts, the connection between marketing spending and number of units sold, price changes, etc.).
If we have multiple products, we calculate them in a similar manner.
Cost of goods sold
Cost of goods sold – or COGS – refers to the direct costs of producing the goods sold. Depending on the complexity you could also summarize cost of sales here or keep it separately.
Often, the COGS are directly linked to the number of units produced so you could refer to the numbers already calculated for the revenues.
In our example from above, we don’t have any direct costs for producing the Excel add-ins because we develop them ourselves and our salary will be regarded under “Salaries and Benefits”.
All other expenses
The structure of the expenses highly depends on your business. I usually start with these:
- Salaries and Benefits
- Rent and Overhead
- Marketing and Advertising
- Other expenses
Again, these items might look completely different for you. Example: if you travel a lot for your business, you might plan travel costs separately.
Subtracting costs from the revenue leads to the EBITDA (earnings before interest, taxes, depreciation, and amortization). This is one of the important financial performance indicators.
Amortization and depreciation
If you buy any assets for your business (for example machines, computers, even cars), you usually plan to use them over a certain period. When you first buy them, let’s say for 1,000 USD, you basically just exchange money for assets in the same amount. The problem: The assets will decrease in value the longer you use them. Within the cost items above, you don’t regard the acquisition value. So, how to regard them in your business plan?
You only regard the annual decrease of value. If you plan to use your 1,000 USD item for 5 years, you could (plainly speaking), each year regard 200 USD as depreciation.
Please note: If you later plan your cash, you have to make sure that you fully regard the initial sales price and not the depreciation.
The key difference between amortization and depreciation is that amortization is used for intangible assets, while depreciation is used for tangible assets. https://www.fool.com/knowledge-center/whats-the-difference-between-amortization-deprecia.aspx
Subtracting the amortization and depreciation from the EBITDA leads to the second key performance indicator, the EBIT (earnings before interest and tax).
Interest and taxes
Eventually, you have to prognose your interest costs (for example what you have to pay for bank loans) and your taxes, which is typically just a percentage of the EBT (the earning before taxes).
Advice 3: Think about the business drivers carefully
Good business plans are driver based.
Business drivers are the key inputs and activities that drive the operational and financial results of a business. Common examples of business drivers are salespeople, number of stores, website traffic, number and price of products sold, units of production, etc. https://corporatefinanceinstitute.com/resources/knowledge/modeling/business-drivers/
Let me explain with an example: You want to plan the revenues. You have two different options:
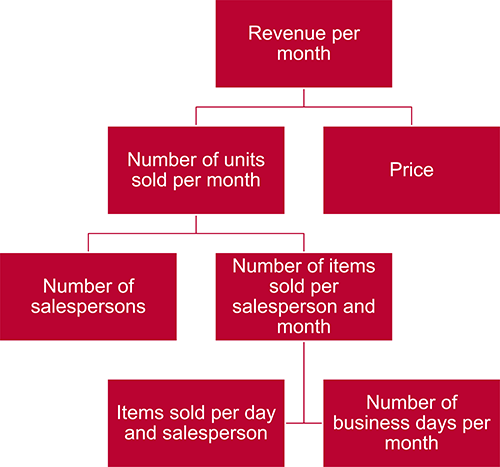
- Revenue per month is split into number of units sold times price per unit.
- Number of units sold is further split into number of salespersons and number of items sold per salesperson and month, and so on.
- Or you could just write a number and every following year you assume a growth in percentage (e.g. +2% per year).
Let’s finish this section with some final comments:
- Choose drivers that are measurable. You will most probably later on compare the drivers to reality and therefore make sure that they are not impossible to measure.
- Figure out, which driver has most impact. You should focus on those first. Driver with no or very limited impact can be skipped initially.
- Are drivers depending on each other? If yes, it should be modeled accordingly.
Advice 4: Choose the smallest period from the beginning in your business plan
So far, we have been focusing on the line items, for example costs, revenue, or drivers. Now, let’s talk about the time frame.
The question is: Should you plan on annual, monthly or any other basis? Or a mix?
I have seen many business plans doing it something like this:
- Plan on monthly basis for the first 24 to 36 months.
- Switch to annual planning for the years 3/4 to 5.
Most business plans are not going beyond 5 years planning period.
My recommendation: Plan on monthly basis for the full period. There will be a point in time when you need to break it down into months. And it is always easier to sum up 12 months for annual values than to drill down from years to months.
Do you want to boost your productivity in Excel ?
Get the Professor Excel ribbon!
Add more than 120 great features to Excel!
Advice 5: Keep a unified, professional business plan structure
This advice should count for most Excel models: Try to keep the same structure throughout the whole Excel file.
- Structure of worksheets: Make sure that most worksheets are set up with the same structure. For example, start with a headline in cell B2, years starting in column H, content in row 10.
- Layout / format of cells: Make sure you use a consistent formatting. For example, Excel provides cell styles – use them. For more recommendations about professional formatting, please refer to this article .
- Universal settings and assumptions should be consolidated on one sheet (for example tax rates, start date, company name).
Advice 6: Document business plan assumptions well

I can not say this often enough: Document your assumptions! Not only the values or variables, also your thoughts behind them. Why have you chosen this value? What is it based on? What is it used for?
Advice 7: Gross vs. net values
This question I am asked quite frequently: Should you use gross or net values? That means, include tax in revenues and costs?
Typically, you only work with net values, excluding VAT. For Germany with a tax rate of 19%, for example, if you invoice 119 EUR to a customer, you would only regard 100 EUR. Also, for costs, you would only regard net values.
Then, in your business plan, you start with revenue minus costs and eventually reach the EBT (earning before tax, please scroll up to see the P&L). From this, you calculate your company tax.
Advice 8: Think ahead
Some more things you should keep in mind when creating your business plan.
- Business plans are “living documents”. Keep in mind that at some point in the future you have to update it or extend it.
- Validate your assumptions: After some time, you will come back to your plan having real life figures. Now, it’s time to compare and – if necessary – adjust the plan.
- a valuation (“Discounted Cash Flow model”),
- liquidity planning,
- bank loan simulations,
- financial dashboards,
- budget planning,
- maybe even the first real official P&L (at least when it comes to the line items of your business plan)
- and much more…
Download business plan template
So, after reading all this description and advice, it’s time to start. Probably many things I have written above sounds like common sense, right? But I can assure you: Doing it and regarding as much advice as possible is not necessarily simple.
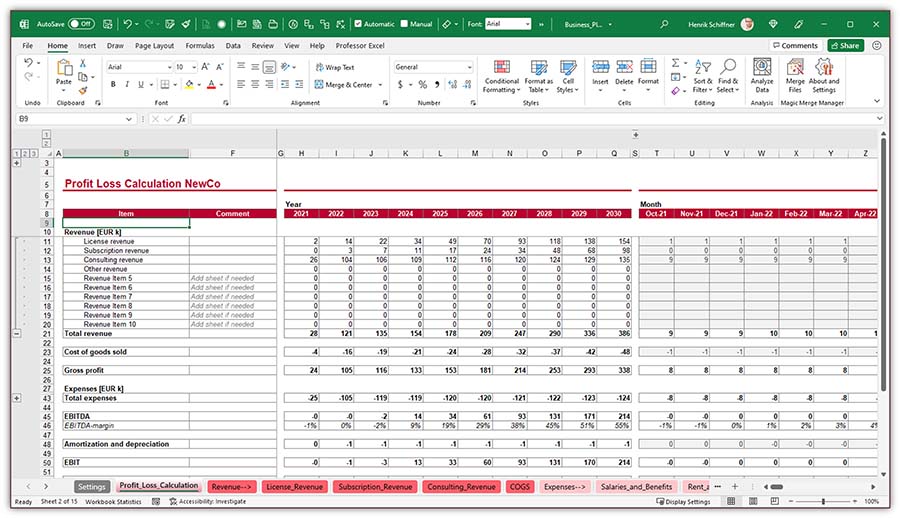
That’s why I have decided to create a template. I have pre-filled it with an imaginary example.
I know, there are countless Excel business plan templates around. So, why should you use this one?
- This template is very flexible: I have always included place holders so that you can add much more items if needed.
- In terms of the time frame, I have created monthly columns for up to ten years. Typically, you need less. Then just hide the extra columns.
- Also, I have created a consistent structure throughout the model.
- No fancy Excel functions and formulas, mainly just plain links.
Please feel free to take a look at it. If you like it, just use it. If not, please feel free to create your individual business plan – you now know how to do it!
Download link: Click here to start the download .
Image by koon boh Goh from Pixabay
Image by mohamed Hassan from Pixabay
Image by Memed_Nurrohmad from Pixabay
Henrik Schiffner is a freelance business consultant and software developer. He lives and works in Hamburg, Germany. Besides being an Excel enthusiast he loves photography and sports.
Leave a comment Cancel reply
Your email address will not be published. Required fields are marked *
Save my name, email, and website in this browser for the next time I comment.
Privacy Overview
Financial management.
Keeping your finances in check is easy to start-and maintain- when you use an excel budget planning template in your financial management routine. customize an excel template to suit your unique financial management needs, whether you're balancing the books of a small business or keeping track of your household budget..
Budget your personal and business finances using these templates
Manage your finances using Excel templates. Stay on track for your personal and business goals by evaluating your income and expenses. Use these templates to add in pie charts and bar graphs so that you can visualize how your finances change over time. Create infographics that show what categories are included in your budget and the types of factors that incorporate each category. Download your financial management template so that you can access it and edit it as you need.

Popular Keywords
Total Results
No Record Found
Home » Budget » Business Plan
Download Business Plan Template In Excel
- Budget , Business management , Excel Templates
Kickstart Your Business Success with Our Free Excel Business Plan Template
Charting a path to success for your business can be overwhelming, especially when it comes to organizing and managing the myriad elements that constitute a business plan. That’s why we’re thrilled to introduce our free, comprehensive Business Plan Excel template. With multiple, integrated sheets for every facet of your planning needs, this template streamlines your strategic process, saving you time and effort.
What Is Included in Our Sample Business Plan Template in Excel?
Our Excel business plan template is meticulously designed and includes the following components:
- Sales Planning / Forecasting Template : This template enables you to plan product-wise and year-wise sales. By analyzing trends over the previous two years, you can forecast sales for the coming year and make informed business decisions.
- Profit and Loss Template : This sheet will help you track your revenues, costs, and expenses to determine your business’s profitability over a period of time.
- Balance Sheet Template : It provides a snapshot of your company’s financial position at a particular moment, illustrating what the company owns (assets) and owes (liabilities), and the amount invested by shareholders (equity).
- Cash Flow Template : With this, you can manage your cash position by tracking the inflow and outflow of cash in your business. This template helps in monitoring your liquidity and understanding if you have enough cash to cover your expenses.
- Budget Template : This facilitates the allocation and tracking of financial resources, ensuring you don’t overspend and stay on the right financial track.
- Break-Even Analysis Template : This crucial template calculates the point where your total cost equals your total revenue. Understanding your break-even point can help guide pricing strategy, monitor efficiency, and make profitable business decisions.
How to Use the Excel Business Plan Template?
Using our comprehensive Excel business plan template is simple:
- Download the Template : Start by downloading our free Business Plan Excel template.
- Input Your Data : Enter your business data into each sheet. Each section comes with clear instructions on what information is needed.
- Analyze and Plan : Use the data you’ve entered to analyze your current business situation, make projections, and develop strategic plans.
- Update Regularly : As your business evolves, so should your business plan. Regularly update the data in the template to keep your plan relevant and responsive to your business’s changing circumstances.
Why Use the Excel Business Plan Template?
Our Excel business plan template offers a host of benefits:
- Comprehensive : It covers every aspect of your business plan, eliminating the need for multiple documents or programs.
- Easy to Use : The template is designed to be user-friendly, making it easy for anyone, regardless of their familiarity with Excel.
- Customizable : The template can be modified to suit the specific needs and nature of your business.
- Effective Visualization : The template includes graphs and charts, transforming your data into a visual format that’s easier to understand and present.
- Free : Our template is completely free, making it a cost-effective solution for business planning.
In conclusion, our Excel business plan template simplifies the planning process by consolidating all elements of a business plan into a single, comprehensive document. Whether you’re drafting your first business plan or refining an existing one, this template can be an invaluable tool. So, download our free Excel business plan template today and embark on a strategic journey to business success!
Users of This Free Business Plan Template
The Excel Business Plan Template is designed for a wide variety of users who need to develop a structured and strategic approach to their business planning. Here’s a list of individuals and entities who could greatly benefit from using this template:
- Entrepreneurs and Startups : If you’re in the initial stages of starting a business, this template can help you plan, analyze, and forecast various aspects of your business such as sales, finances, and cash flow.
- Small Business Owners : For existing small businesses, this template can help monitor performance, manage finances, and plan for future growth.
- Financial Analysts and Managers : These professionals can use this template to gain insights into the financial health of a business, plan budgets, and conduct break-even analysis.
- Freelancers and Solopreneurs : Even if you’re a one-person business, this template can help keep track of your finances, forecast your revenue, and manage your cash flow efficiently.
- Consultants and Business Advisors : These individuals can utilize the template to assist their clients in developing business plans, improving financial management, and setting strategic goals.
- Non-profit Organizations : Even though their goals might not be profit-oriented, non-profit organizations can also benefit from this template to manage their finances, plan budgets, and conduct break-even analysis for their fundraising events or projects.
Remember, the key to leveraging this tool effectively is to customize it to the unique needs and circumstances of your business or project. No matter your industry or the size of your business, our Excel Business Plan Template can be a valuable tool in your strategic planning toolkit.
Download this Business Plan template in Excel Format
Our easy to use editable Excel templates and save your significant amount of time and effort. Here’s how to download and use one of our templates:
Download this free Excel Template : Once you’ve browsed through our collection of templates and find the one that best fits your needs. Once you’ve found the template you want, click on the download button.
Replace sample data with your actual data: Once the template is downloaded, open it in Excel. You’ll see that it is already set up with sample data. To start analyzing your own data, simply replace the sample data with your actual data.
Customize the template: Our templates are completely editable, which means you can customize them to fit your specific needs. For example, you can change the formatting, add or remove columns, or create new charts and graphs.
Use the Excel template: Once you’ve fed in your data and customized the template, you’re ready to start using it for data analysis. Use the various tools and features of Excel to analyze and visualize your data, and make informed business decisions.
Save and share: Once you’ve finished working on the template, save it to your computer and share it with other members of your team or stakeholders as needed.
Click Download Button To Get Business Plan Excel Template
Instruction :
All Excel templates and tools are sole property of xlsxtemplates.com. User can only download and use the excel templates for their Personal use only. All templates provided by XLSX templates are free and no payment is asked. However, you are not allowed to distribute or share in any other website for sole purpose of generating revenue from it.
You can also download and use our 1000 Best PowerPoint Presentation Templates and 500 Resume Samples from PPTXTemplates.com Completely Free. All our templates are designed by Professionals
- Tags business plan , business plan example , business plan layout , business plan step by step , business plan template , business plan template free , business planner , excel , excel budget template , excel business financial plan template , excel business planner template , excel project plan template , excel template , excel templates , excel templates for business , excel templates free download , how to write a business plan , project plan in excel , sample business plan
Business Plan Template
Excel Template Category
Business management, data analysis, decision matrix, educational, event budget, excel addins, excel chart, excel planners, excel templates, federal income tax, financial calculator, financial management, financial statement, gantt chart, gst templates, health and fitness, home & personal, human resource, inventory management, invoice templates, list & checklist, personal finance, project management, sales & marketing, social media, timesheet & payroll, download free editable excel templates | popular templates.
Insurance Quote
Introduction: Streamlining Insurance Quotations An insurance quote is a vital document in the insurance industry, serving as a preliminary estimate of premiums for potential clients.
Freelance Quotation
Introduction: Mastering Freelance Quotations In the world of freelancing, creating an effective quotation is crucial for outlining the scope and cost of your services to
Fencing Quotation
Introduction: Navigating Fencing Service Quotations A fencing service quotation is an essential tool for businesses in the fencing industry. It provides potential clients with a
Event Planning Quotations
Introduction: Excelling with Event Planning Quotations An event planning quote is a critical document for event planners, detailing proposed services and costs for organizing an
Construction Quote
Introduction: Optimizing Construction Quotations A construction quote is a fundamental document in the construction industry, serving as a formal proposal of costs for construction services
Cleaning Quote
Introduction: Perfecting Cleaning Service Quotations Creating an effective cleaning service quotation is crucial in the cleaning business. It serves as a formal proposal outlining the
Free editable professional Excel templates can be a useful tool for businesses , organizations, and individuals looking to streamline their data management and reporting processes. These templates can provide a pre-designed and pre-formatted framework for storing and organizing data, as well as for creating charts, graphs, and other visualizations to help communicate that data more effectively.
One advantage of using professional Excel templates is that they are often designed by experienced professionals who understand best practices for data management and visualization. This means that the templates are likely to be well-organized, easy to understand, and aesthetically pleasing, which can make working with them more efficient and enjoyable.
Another advantage is that these templates are often fully editable, allowing users to customize them to meet the specific needs of their organization or project. This can include adding or deleting rows and columns, changing the formatting and layout, and adding custom formulas and functions .
Some examples of professional Excel templates that may be available for free include budgeting templates for personal or business use , project management templates for tracking tasks and deadlines, and sales tracking templates for analyzing and forecasting sales data. There are also a wide variety of templates available for specific industries, such as real estate, marketing , human resource , Payroll management and among others.
Overall, free editable professional Excel templates can be a valuable resource for anyone looking to improve their data management and analysis skills. By providing a pre-designed and customizable framework for storing, organizing, and visualizing data, these templates can help users save time and make more informed decisions.
Free Excel Templates
Welcome to Excel Templates – your ultimate destination for all things related to Excel! We pride ourselves on being a comprehensive, 100% free platform dedicated to providing top-notch, easily editable Excel templates, step-by-step tutorials, and useful macro codes. With fresh templates uploaded daily, we aim to meet every conceivable Excel need you may have. Whether you’re a student, a business professional, or someone looking to make sense of their data, our range of templates has you covered. Dive into the world of Excel Templates today and transform your number-crunching experience into an effortless journey of discovery and efficiency. Join our growing community and elevate your Excel game now.
- Basic Excel Tutorials
- Excel Formulas
- Excel Shortcuts
- Advance Excel Tips
- Finance Tips
- Excel Macros Codes
- Pivot Table Tips
DMCA Policy
Privacy Policy
© 2023 xlsxtemplates all rights reserved

Search Product category Any value Sample Label 1 Sample Label 2 Sample Label 3
Expert-built business plan and financial model templates
Download the template for your business. Customise it. Get funded.
Try restaurant business plan ecommerce financial model Dunkin' Donuts franchise financial model
Trusted by 12,000+ entrepreneurs, consultants and investors

Vetted by professionals at leading organizations

BuSINESS PLANS
Professional powerpoint business plan templates to raise funding.
- 30+ slides already completed
- Business overview
- Updated market research
- Sales & marketing plan
- SWOT, competitive landscape
Financial models
Easy-to-use excel financial models for serious entrepreneurs.
- Cash flow statement
- Business valuation (DCF)
- 20+ charts and metrics

Create a business plan
You've been dreaming of starting your own business. You've started with some concrete steps, and you're ready to put your proposal together. But how do you start, and how do you know when you have the right information?
How to get it done
Create a business plan with templates in Word:

Start with a template
Download these templates from the Office Templates site to create your plan:
Fill in your Business plan .
Analyze your market with the Business market analysis template .
Detail your financials in a Financial plan .
Divide up the work and track deliverables with this Business plan checklist .
Wrap up with this Business startup checklist .
Need a little help?
Learn how to:
Start a document from a template .
Apply themes to change your plan's look.
Related resources
Related article
Must follow steps for starting a successful business
Buy Microsoft 365
Get Microsoft 365
Get help setting up
Training and in-person help

Need more help?
Want more options.
Explore subscription benefits, browse training courses, learn how to secure your device, and more.

Microsoft 365 subscription benefits

Microsoft 365 training

Microsoft security

Accessibility center
Communities help you ask and answer questions, give feedback, and hear from experts with rich knowledge.

Ask the Microsoft Community

Microsoft Tech Community

Windows Insiders
Microsoft 365 Insiders
Was this information helpful?
Thank you for your feedback.
FinModelsLab

Industry-Specific Financial Model Templates in Excel

Food & Beverage Financial Models

Healthcare Financial Models

Agriculture Financial Models

Marketplace Financial Models

Hospitality Financial Models

E-Commerce Financial Models

Beauty & Sport Financial Models

Subscription Box Financial Models

Real Estate Financial Models

Services Financial Models

Retail Financial Models

Software as a Service Financial Models
- Financial Models
- Business Plans
Restaurant Financial Model
Boutique hotel financial model, clinic financial model, saas financial model, grocery marketplace financial model, medical practice financial model, hotel financial model, dropshipping financial model, massage therapy financial model, solar panel financial model, clothing manufacturing financial model, brewery financial model, medical equipment manufacturing financial model, fintech financial model, frozen food financial model, e-commerce financial model, cannabis financial model, juice production financial model, mobile application financial model, daycare financial model, meat processing plant financial model, coffee roasting financial model, consulting agency financial model, digital marketing agency financial model, financial model for 3 statements, 3 statement projection tool, three-way financial analysis model, three statement financial plan, vegetables farming financial model, our happy customers.
I have been doing capital raising in a wide variety of industries and have been involved on 4 Private Equity Funds. Financial models tend to be either too simplistic or too complicated and useless. But this model is the perfect mix of simplistic and intuitive with enough detail for large project funding analysis. It could even be used as a budgeting tool for smaller mining companies. Well Done! And Thank You very much!
Great financial model template with the most complete set of charts that will ever need! Monthly breakdowns for all the financial statements and a cash valuation. Summary tabs with all the main information you need for a business plan! Could be improved with the addition of financial ratios.
What an incredible find in FinModelsLab! The ASC model is perfect for modeling our healthcare practice… enthusiastically recommend!!!
The spear sheet is just what I needed. I am able to plug in my numbers and the video shows you where to place all information. I can now send the pro-forma to investors. Love it thank you
Henry was a life-saver. If you have a very difficult financial modeling project that you need delivered fast, go with Henry. He will get it done.
Henry is very good at forecasting and business modelling. His communication and responsiveness are excellent.
Henry was the best financial expert for us when it came to financial analysis and building financial complex models for our start-up.
Excellent CFO I have ever come across. He has an eye to detail and is an expert when to comes to financial modeling & planning.
A complete and easy to use Restaurant financial model that gives you clear view and guide when preparing business plan numbers
I really feel there is no finance challenge Henry can't overcome, and I look forward to working with him on many more projects and entrepreneurial initiatives.
Henry is incredibly talented and hard working. He is one of the top-notch players in his niche, He pushed out a rock solid deliverable.
Industry-specific Financial Model Templates in Excel, Business Plan Templates, Excel Dashboards and Pitch Decks
FinModelsLab provides a wide range of industry-specific financial model templates in Excel as well as Excel dashboards, Business Plan Templates, and Pitch Deck Templates. Creating a business plan with detailed financial projections and pitch deck presentation or Excel dashboard is time-consuming. That is why we created a web repository with 1500+ business templates for a wide range of usage cases. We spent 10 000+ hours creating industry-specific financial forecasting model templates in Excel which offers a well-structured as well as best practice financial modeling know-how to users such as c-level executives, entrepreneurs, investors, startup founders, and many more, who are looking for assistance in creating financial projections template.
In today's fast-paced business landscape, effective financial modeling and planning are crucial for the success and growth of any organization. With accurate financial projections, businesses can make informed decisions, secure funding, and navigate potential challenges with confidence. At FinModelsLab, we understand the significance of financial modeling, which is why we offer a comprehensive collection of industry-specific financial model templates in Excel.
The Importance of Financial Modeling
Financial modeling serves as the foundation for strategic decision-making, providing insights into the financial health and performance of a business. It allows organizations to forecast revenue, project expenses, assess profitability, and evaluate potential risks and opportunities. By modeling different scenarios, businesses can optimize their resources, identify growth strategies, and plan for the future.
Addressing the Need for Industry-Specific Templates
Generic financial templates may not capture the unique requirements and dynamics of specific industries. That's where industry-specific financial model templates become invaluable. At FinModelsLab, we recognize the importance of tailoring financial models to the nuances of different sectors. Our extensive collection includes a wide range of industry-specific templates, ensuring that businesses have the tools they need to accurately project revenues, analyze costs, and plan for success in their respective sectors.
- Comprehensive financial model templates designed for specific industries.
- Templates catering to diverse sectors such as manufacturing, e-commerce, healthcare, and more.
- Industry-specific financial model templates for startups, small businesses, and established enterprises.
By providing industry-specific financial model templates, we empower businesses to make informed decisions based on reliable and relevant data, ultimately increasing their chances of success in the marketplace.
About FinModelsLab
At FinModelsLab, we pride ourselves on being a trusted and reliable source for financial model templates. With our commitment to excellence and a comprehensive collection of over 3500+ business templates, we empower entrepreneurs, startups, investors, and professionals to create accurate and detailed financial projections.
Reliable Financial Projections Templates
Our platform offers a vast selection of financial projections templates that cater to various industries and business models. Each template is designed by our team of financial experts, ensuring that they meet industry standards and best practices. Whether you are starting a new venture or seeking to optimize your existing business, our templates provide a solid foundation for projecting revenues, estimating costs, and analyzing profitability.
A Wide Range of Business Templates
With a collection of 3500+ business templates, we cover a diverse range of industries, including manufacturing, e-commerce, SaaS, healthcare, and more. Our templates address different aspects of financial modeling, such as cash flow analysis, income statements, balance sheets, and valuation models. This comprehensive assortment enables users to find the templates that best align with their specific business needs.
- 3500+ business templates available for different industries and usage cases.
- Templates for startups, small businesses, investors, and c-level executives.
- Templates covering various financial aspects, including cash flow, income statements, and valuation models.
With FinModelsLab, you can access a wide range of financial projections templates and find the resources necessary to make informed financial decisions for your business.
Expertise and Dedication
At FinModelsLab, we have invested over 10,000 hours of meticulous effort and dedication into creating our financial model templates. This extensive investment of time and expertise reflects our commitment to providing high-quality resources for financial modeling and planning.
Well-Structured Financial Model Templates
Our financial model templates are designed with a well-structured framework that follows industry best practices. Each template encompasses a comprehensive set of financial projections, ensuring that businesses can accurately forecast revenues, expenses, and cash flows. By leveraging our well-structured templates, users can save time and effort, focusing on analyzing the data rather than building models from scratch.
Best Practice Financial Modeling Knowledge
Our team of financial experts brings in-depth knowledge and expertise in financial modeling. We follow best practices and incorporate industry standards into our templates, ensuring that users have access to reliable and accurate financial projections. Whether you are a c-level executive, entrepreneur, investor, or professional seeking robust financial models, our templates provide the necessary guidance and insights to support your decision-making process.
Serving a Diverse Audience
Our financial model templates cater to a diverse audience, including c-level executives, entrepreneurs, investors, and professionals from various industries. We understand the unique needs and challenges faced by different stakeholders, and our templates are tailored to address those requirements. By serving a wide range of users, we aim to empower businesses of all types and sizes to make informed financial decisions and achieve their goals.
- Financial model templates for c-level executives, entrepreneurs, and investors.
- Templates designed to meet the diverse needs of different industries and usage cases.
- Best practice financial modeling knowledge incorporated into every template.
With our expertise and dedication, FinModelsLab strives to provide users with the necessary tools and knowledge to excel in financial modeling and planning.
Benefits of Using Financial Model Templates
Utilizing financial model templates offers significant advantages when it comes to creating accurate financial projections for your business. At FinModelsLab, we understand the importance of these benefits and strive to provide users with the resources they need to succeed.
Accurate Financial Projections Made Easy
Our financial model templates are specifically designed to assist users in creating accurate financial projections. By leveraging these templates, businesses can input their data and variables, which are then automatically calculated to generate comprehensive projections. This process reduces the risk of errors and ensures that the resulting financial projections are reliable and precise.
Time-Saving Pre-Built Templates
Time is a valuable resource for any business, and our pre-built financial model templates help save significant time and effort. Instead of starting from scratch, users can access ready-to-use templates that already include the necessary formulas, calculations, and structure. This allows users to focus on analyzing the projections and making informed decisions, rather than spending excessive time building complex financial models.
Convenience and Ease of Excel for Financial Modeling
Excel has long been recognized as a powerful tool for financial modeling, and our templates capitalize on this convenience. With Excel as the foundation, users can benefit from a familiar and user-friendly interface, making it easier to work with the templates and customize them according to their specific needs. Excel also provides flexibility for users to adapt the templates as their business evolves, ensuring the models remain relevant over time.
- Templates designed to assist in creating accurate financial projections.
- Pre-built templates save time and effort by eliminating the need to start from scratch.
- Excel-based templates provide a convenient and user-friendly platform for financial modeling.
By utilizing our financial model templates, businesses can leverage the benefits of accuracy, time-saving efficiency, and the convenience of working with Excel, ultimately aiding in their financial planning and decision-making processes.
Wide Range of Templates
At FinModelsLab, we offer a diverse selection of financial model templates to cater to various industries and specific business needs. Our extensive range ensures that businesses can find templates tailored to their industry, whether they are a startup, small business, or established enterprise.
Diverse Selection of Industry-Specific Templates
We understand that different industries have unique financial considerations. That's why we provide a wide range of industry-specific financial model templates. From manufacturing to e-commerce, healthcare to SaaS, our templates cover various sectors, ensuring that businesses can create accurate financial projections that align with the dynamics of their industry. These industry-specific templates include revenue forecasts, expense breakdowns, and other relevant financial data, allowing businesses to gain valuable insights and make informed decisions.
Relevance for Startups and Financial Planning
Startups face unique challenges and financial planning is crucial for their success. Our templates include startup-specific financial model templates designed to assist entrepreneurs in their financial planning journey. These templates consider the specific needs of startups, including revenue drivers, cost structures, and funding requirements. By utilizing our startup financial model templates, entrepreneurs can create comprehensive financial projections, pitch to investors, and develop a solid financial strategy for their business.
- A wide range of industry-specific financial model templates.
- Templates catering to startups with startup-specific financial projections.
- Templates covering various industries, including manufacturing, e-commerce, healthcare, SaaS, and more.
Whether you are starting a new venture or operating an established business, our diverse selection of financial model templates ensures that you have the resources needed to create accurate financial projections and drive your business forward.
Importance of Financial Statements
Financial statements play a vital role in business plans, providing a comprehensive view of a company's financial health and performance. At FinModelsLab, we understand the significance of financial statements and offer templates that facilitate the creation of robust and accurate financial statements for your business plan.
Significance of Financial Statements in Business Plans
Financial statements are essential components of any business plan as they present a clear picture of a company's financial position. These statements, including the income statement, balance sheet, and cash flow statement, allow stakeholders to assess the company's profitability, liquidity, and overall financial stability. Financial statements provide crucial information for investors, lenders, and potential partners, aiding in informed decision-making and demonstrating the viability and potential of the business.
Creating Comprehensive Financial Statements with Templates
Our templates are specifically designed to assist users in creating comprehensive financial statements for their business plans. These templates offer a structured framework and predefined formulas that simplify the process of compiling financial data and generating accurate statements. By utilizing our templates, users can input their financial information, and the templates automatically calculate key metrics and generate professional-looking financial statements. This ensures that your business plan is well-supported with accurate and visually appealing financial information.
- The significance of financial statements in business plans for assessing financial health and performance.
- Templates designed to aid in the creation of comprehensive financial statements.
- Financial statements as crucial components for investors, lenders, and potential partners.
With our financial statement templates, you can confidently present a clear and compelling financial snapshot of your business, showcasing its potential and strengthening your business plan.
Excel-Based Financial Templates
At FinModelsLab, we provide a wide range of financial templates that are specifically designed in Excel format, offering users easy customization and flexibility. Our Excel-based templates empower businesses to create accurate and tailored financial models, enabling effective financial planning and decision-making.
Easy Customization and Flexibility
All our financial templates are available in Excel format, which provides users with the ability to easily customize and adapt the templates to suit their specific needs. Excel's intuitive interface allows users to input their own data, adjust formulas, and make modifications as required. Whether it's adding new variables, changing assumptions, or incorporating specific industry metrics, Excel enables users to tailor the templates to their unique requirements, ensuring that the resulting financial models are precise and relevant to their business.
Advantages of Using Excel for Financial Modeling
Excel has long been recognized as a powerful tool for financial modeling, and there are several advantages to utilizing it for your financial planning needs. Excel offers a wide range of built-in functions and formulas, making complex calculations and projections more accessible. Its spreadsheet format provides a structured and organized way to present and analyze financial data, allowing for easy data entry, manipulation, and visualization. Excel's widespread familiarity among professionals also ensures that users can collaborate, share, and present their financial models seamlessly.
- Templates provided in Excel format for easy customization and adaptability.
- Excel's flexibility allows users to tailor templates to their specific needs.
- Advantages of using Excel include built-in functions, structured presentation, and widespread familiarity.
By leveraging our Excel-based financial templates, businesses can benefit from the ease of customization, flexibility, and the robust capabilities of Excel, ultimately enabling them to create accurate and dynamic financial models that drive better financial planning and decision-making.
Financial Forecasting and Planning
Financial forecasting plays a crucial role in effective business planning and decision-making. At FinModelsLab, we recognize the significance of financial forecasting, and we offer a wide range of forecast templates in Excel format to assist businesses in their financial planning endeavors.
The Role of Financial Forecasting in Business Planning
Financial forecasting is a vital component of business planning as it allows organizations to anticipate future financial outcomes based on historical data, market trends, and key assumptions. By creating comprehensive financial forecasts, businesses can gain valuable insights into revenue projections, expense management, and cash flow dynamics. These forecasts help in identifying potential risks, setting realistic targets, and making informed strategic decisions to drive business growth.
Availability of Forecast Templates in Excel
Our forecast templates, available in Excel format, provide businesses with a convenient and efficient way to create accurate financial forecasts. These templates are designed to simplify the forecasting process by incorporating pre-built formulas and intuitive interfaces. Users can input their data, adjust variables, and instantly generate forecasts based on different scenarios. The flexibility of Excel allows for easy customization of the templates to align with specific business needs, ensuring that the resulting forecasts are tailored and reliable.
- The importance of financial forecasting in business planning and decision-making.
- Forecast templates available in Excel format for convenient and accurate financial forecasting.
- Financial forecasts as valuable tools for identifying risks, setting targets, and making strategic decisions.
By utilizing our forecast templates in Excel, businesses can streamline their financial forecasting processes, gain valuable insights, and enhance their overall planning capabilities.
Tailored for Startups
At FinModelsLab, we understand the unique financial planning needs of startups, and we offer a range of templates specifically tailored to meet those needs. Our startup-specific financial projections templates provide startups with a solid foundation for their financial planning and enable them to make informed decisions to drive growth and success.
Relevance of the Templates for Startups' Financial Planning
Startups face distinctive challenges and requirements when it comes to financial planning. Our templates address these specific needs by providing startup founders and entrepreneurs with a comprehensive framework to forecast revenue, estimate expenses, and project cash flow. These templates incorporate startup-specific assumptions and variables, allowing startups to create accurate financial projections that align with their business models, growth strategies, and funding requirements.
Startup-Specific Financial Projections Template
Our startup-specific financial projections template is a valuable resource for startups seeking to create robust financial forecasts. This template encompasses key startup metrics, such as customer acquisition costs, customer lifetime value, and funding rounds, to accurately project revenue, expenses, and funding needs over a defined period. By leveraging this template, startups can effectively communicate their financial projections to potential investors, demonstrate their growth potential, and secure the funding necessary to fuel their development.
- Templates specifically tailored to meet the unique financial planning needs of startups.
- Importance of accurate financial projections for startups to make informed decisions.
- Startup-specific financial projections template incorporating key startup metrics.
Our startup-focused templates empower entrepreneurs and startup founders to navigate the financial landscape with confidence, ensuring that their financial planning aligns with their business goals and positions them for long-term success.
Excel-Based Financial Modeling
Excel is a powerful tool for financial modeling, and at FinModelsLab, we leverage the capabilities of Excel to provide comprehensive and effective financial model templates. Our Excel-based financial models offer numerous benefits for businesses, empowering them to make informed financial decisions and drive success.
Benefits of Using Excel for Financial Modeling
Excel provides a range of benefits that make it an ideal platform for financial modeling. Its built-in functions and formulas allow for complex calculations, enabling accurate financial projections and analysis. The spreadsheet format of Excel provides a structured and organized way to present and manipulate financial data, making it easier to input and track variables, assumptions, and key metrics. Excel's flexibility also allows for scenario analysis, sensitivity testing, and the creation of dynamic charts and graphs, enhancing the visibility and understanding of financial models.
Availability of Excel Financial Model Templates
Our Excel financial model templates provide businesses with ready-to-use frameworks for various financial modeling purposes. These templates are designed to streamline the financial modeling process, incorporating best practices and industry-specific assumptions. By leveraging our Excel financial model templates, businesses can save valuable time and effort in building their own models from scratch, while still having the flexibility to customize and adapt the templates to their specific needs.
- Excel's capabilities for complex calculations, accurate projections, and analysis.
- The structured format of Excel for organized financial data management.
- Excel's flexibility for scenario analysis, sensitivity testing, and visual representation.
- Availability of ready-to-use Excel financial model templates for streamlined financial modeling.
By utilizing our Excel-based financial model templates, businesses can harness the power of Excel and benefit from its robust features to create accurate, dynamic, and customizable financial models that drive better financial decision-making and planning.
In today's competitive business landscape, financial modeling is essential for informed decision-making and successful planning. At FinModelsLab, our industry-specific financial model templates in Excel offer a range of benefits to empower businesses and individuals in their financial projections and planning endeavors.
Reaping the Benefits of Industry-Specific Financial Model Templates
Our industry-specific financial model templates provide users with a host of advantages. By utilizing these templates, businesses can save valuable time and effort, as our templates are pre-built with best practices and industry-specific assumptions. This enables users to create accurate and reliable financial projections that align with their unique needs and goals. Whether you are a c-level executive, entrepreneur, investor, or startup founder, our templates offer a well-structured and comprehensive financial modeling know-how, supporting your financial planning and decision-making processes.
Explore Our Wide Range of Templates
We invite you to explore our extensive collection of 3500+ business templates, including financial modeling Excel templates and financial projections template Excel. Our diverse selection ensures that you will find the right template for your industry and specific use case. Whether you are starting a new venture, seeking funding, or managing an existing business, our templates provide the foundation you need for accurate financial projections and comprehensive planning.
- The benefits of using industry-specific financial model templates for informed decision-making and successful planning.
- Time-saving advantages through pre-built templates with best practices and industry-specific assumptions.
- Wide range of 3500+ business templates, including financial modeling Excel templates and financial projections template Excel.
Begin your journey towards effective financial modeling and planning by exploring our wide range of templates. Empower your business with accurate financial projections and make confident decisions to drive growth and success.
Why is a Financial Plan Important to Your Small Business?
A well-put-together financial plan can help you achieve greater confidence in your business while generating a better understanding of how to allocate resources. It shows your business is committed to spending wisely and its ability to meet financial obligations. A financial forecasting model helps you determine if choices will impact revenue and which occasions call for dipping into reserve funds.
It’s also an important tool when asking investors to consider your business. Your startup financial plan shows how your organization manages expenses and generates revenue. It shows where your business stands and how much it needs from sales and investors to meet important financial benchmarks.
Used by Professionals from 300+ Companies Including

Frequently Asked Questions
Of course! Yes. All our templates are fully editable . All formulas, cells and sheets are completely unlocked, so you can edit anything to your liking. Each row on every sheet has a note about what that row’s calculations are trying to do, and many of the components are explained in the help files, so that you can see how I did it - and help you figure out how to change it to your liking.
This financial model is perfect for entrepreneurs to quickly build financial projections for fundraising decks or business modeling.
With this all-in-1 model, you’ll be able to forecast your sales, profits, and cash flow in seconds. Plus, you’ll have all the data, metrics and reports you’ll need to effectively present your business plan to investors & prospects. This financial model was crafted in Excel by expert analysts with 15-years consulting background to assist entrepreneurs with forecasting efforts.
Take advantage of this Excel model to effortlessly forecast your financials, create investor-friendly reports, and build a better business!
You don’t have to be an expert to model your Profit and Loss Statement (P&L) with this straightforward financial model excel template. Our financial projection makes that easy for even the most novice finance background. Just enter your financials and our sophisticated financial model will do all the work, giving you a clear view of your company’s current state, predictions for future performance, and an action plan for scaling revenue. With financial projections that can be easily updated as assumptions change, you’ll have all the information you need to project your company’s future & pitch investors!
Yes. Our financial model excel templates are fully editable, you can change many assumptions including the currency of your business.
You may change currency inputs and currency outputs by applying the exchange rate.
All our financial model templates are Microsoft Excel™ files, and they are available for download immediately after purchase. Can be imported into the Google Sheets™ for editing and customizations. I recommend using Excel or Google Sheets™ for financial modeling, both in general and for our templates specifically. In practice, I use Excel to build and edit models, and Google Sheets to share or collaborate with users. Excel is usually a faster platform for building models, but Google Sheets can be easier for sharing models with people. My models can be used in both Excel and Google Sheets interchangeably; simply upload the Microsoft Excel model template from FinancialModelExcel.com into Google Sheets, and everything will work fine.
Unfortunately no. Unlike a physical product where you can send it back to the seller, because it is a digital product you can still use it after refund. This makes it quite difficult for us to manage honest refund requests. If you have any questions about the financial model excel templates, please contact us so we can guide you and answer any questions you have.
Yes. We accept all major credit cards, debit cards and PayPal. Payments are powered by Stripe and PayPal via our payment processing provider. All transactions are secured and your card payment information encrypted and sent directly to Stripe and PayPal, no payment details are stored on our website.
Yes. Of course! Every financial model excel template has a button to download immediately a DEMO version of the particular template. With the Demo version you will get the read-only financial model template.
By purchasing the template on our website, you will receive an email from us including the link to download your template. Additionally, you should see the download links right after the payment at the checkout page.
Yes, we provide free email support via email at [email protected] . We are in the Europe time zone hence please bear with us and we will catch up as soon as we are back online!
- 17 min read
Top 11 Excel Finance Templates and Financial Statements for 2023

1. Business Case Template
2. profit and loss (p&l) statement template, 3. unit economics template, 4. headcount and workforce planning template, 5. runway and cash budget template, 6. balance sheet template, 7. revenue forecasting template, 8. sales compensation plan template, 9. e-commerce demand forecasting template, 10. operating budget template, 11. capitalization table template.
Excel templates and financial models are powerful tools for budgeting and planning. With Excel, you can create a personal budget that helps you track your spending, plan ahead for future expenses and investments, and monitor your overall financial health.
You can also use Excel to build more complex financial models that help with forecasting, decision-making, investment analysis, and more. Whatever your financial goals, Excel provides the templates and tools to help you achieve them.
With Excel templates for budgets, financial statements, forecasting models, investment analysis, and more, Excel gives you the power to make informed decisions about your money.
Excel is easy to use and can be used by anyone, from novice users to experienced financial professionals. It is the premier tool for creating accurate budgets, forecasting future trends, and investing wisely.
So without further ado, here is a list of the top 11 Excel Finance Templates and Financial Models to help you manage your business financials, monitor performance, and make smarter business decisions.

A Business Case Excel Template is a spreadsheet that can be used to make business decisions. It helps you organize and analyze data in order to help you reach the best possible outcome for your project or venture.
The template typically includes excel columns for data such as cost-benefit analysis, risk assessment, financials, resource breakdowns, and more. By using the Excel template, you can quickly identify areas of potential savings or risks before making final investment decisions on any business venture.
Additionally, this type of Excel template makes it easier to track progress throughout the project lifecycle and compare results against expectations. With an Excel template, you will have an effective tool for assessing costs and benefits when making important business decisions.
Download the Business Case Excel Template for Free.

A Profit and Loss (P&L) Statement Excel Template is a spreadsheet tool designed to help you organize and track your business's income and expenses each month. This template makes it easy to quickly generate an accurate Profit & Loss statement, which can be used for both internal records as well as external reporting.
The Excel template includes columns for entering revenue and cost of goods sold, as well as expenses such as wages and rent. At the end of each month, it is possible to generate a snapshot of your business's performance for that month.
With this data, you can make better-informed decisions about how to maximize your profits and minimize losses. Using a P&L excel template also helps ensure accuracy in financial reporting. The Excel template is easy to use and can be customized to meet your specific needs. With this tool, you can identify areas of growth and focus on improving them for the future success of your business.
Download the Profit and Loss (P&L) Statement Excel Template for Free.

A Unit Economics Excel Template is an Excel-based document that provides a framework for analyzing the financial performance of each unit within a business. The template enables users to input key metrics such as revenue, cost, and margin per unit to generate comprehensive insights into the performance of their business model.
By leveraging the power of Excel and data visualization, users can gain valuable insight into their business’s efficiency, profitability, and sustainability. The Excel template also serves as a powerful tool for tracking changes in unit economics over time and comparing different scenarios side by side.
With this information at hand, businesses are able to make informed decisions regarding pricing strategies, product development initiatives, marketing campaigns, and more. A Unit Economics Excel Template is an invaluable asset for any company looking to maximize its profits and excel in the market.
Download the Unit Economics Excel Template for Free.

A Headcount and Workforce Planning Template is a customizable Excel template that helps businesses manage their workforce. It is designed to track the current headcount, average hours worked, and employee costs. The template also allows users to plan future staffing needs by setting estimated headcount goals for each quarter or year.
With the help of this Excel template, business owners can make more efficient decisions when planning their budget and personnel resources. The Excel template includes features such as forecasting total labor cost in relation to other operating expenses, tracking changes in employee count over time, and providing graphical visualizations of staffing trends.
This Excel template enables businesses to quickly forecast the size of their workforce based on demand projections for the upcoming fiscal period. It is an invaluable tool for determining your company’s future workforce needs and budgeting accordingly.
Using a Headcount and Workforce Planning template helps businesses save time, money, and resources by giving them an easy-to-use method for tracking changes in headcount over time. The Excel template also serves as a valuable resource for business owners to gain insight into their staff's productivity, performance, and cost-effectiveness. With the help of this Excel template, businesses can easily plan their workforce needs and make better-informed staffing decisions.
Download the Headcount and Workforce Planning Excel Template for Free.

A Runway and Cash Budget Template is an Excel spreadsheet that helps businesses plan ahead by budgeting for their anticipated expenses. It outlines what money will be coming in and going out over a certain period of time, allowing users to adjust and balance their budget accordingly.
The template also provides projections on how much cash the business can expect to have available at any given point during the forecasted period, helping them make informed decisions about when it’s best to purchase assets or hire new staff. Using an Excel template simplifies the process of creating a runway and cash budget, as all of the information can be managed in one place.
It also makes it easy to make changes and tweak different variables, so businesses can always stay up-to-date with their finances. With a Runway and Cash Budget Template, businesses can gain greater insight into their financial situation and make sure that they are always prepared for the future.
Download the Runway and Cash Budget Excel Template for Free.

A Balance Sheet Excel Template is a type of spreadsheet that allows users to create, maintain and analyze their financial information. This template provides a comprehensive overview of an individual’s or company’s financial status at any given point in time. It includes detailed lists of liabilities, assets, and equity accounts which are used to calculate the net worth at any point in time.
By using this template, it will be easier for individuals and businesses to track their financial performance as well as identify potential areas for improvement. With this template, users can also view their overall financial health over time, allowing them to make informed decisions.
Balance Sheets are generally prepared on an annual or quarterly basis, giving accurate insights into your current financial position. They help you to identify areas that require further attention and make informed decisions about your financial future.
Download the Balance Sheet Excel Template for Free.

Top Free Google Sheets Templates and Financial Statements to help you manage your business financials, monitor performance, and make informed decisions.

A Revenue Forecasting Excel Template is a spreadsheet that helps businesses estimate their potential revenues for the upcoming months. It allows companies to quickly make projections about how much money they can expect to generate in the future and plan accordingly. The template usually includes fields for entering past sales figures, projecting cash flows based on historical performance, forecasting seasonality effects, and making other predictions. It can help companies get an accurate picture of their expected revenues, enabling them to optimize their business operations and make better decisions.
Having a reliable revenue forecasting template can help businesses reach their goals faster and with more efficiency. With the right Revenue Forecasting Excel Template, businesses can improve their monthly or yearly performance without having to hire an expensive consultant. It’s a valuable tool for any business, big or small.
Using the template is easy - simply enter your historical data, and it will generate an estimated revenue projection for you. With this information, you can plan better and make sure that your business operates at peak efficiency. The template also helps identify potential areas for improvement, giving you insights into how your business can become more efficient and profitable.
Overall, a Revenue Forecasting Excel Template is an invaluable tool for any business that is looking to maximize its profits and make the most of its resources. It provides valuable insights into future cash flows and helps businesses make better decisions about their operations.
Download the Revenue Forecasting Excel Template for Free.

A Sales Compensation Plan Excel Template is an easy-to-use tool that can help you track and manage your sales compensation plan. It allows business owners to quickly create a comprehensive document outlining the different commission structures applicable to their sales team.
The template offers customizable features such as dynamic columns for data entry and Excel formulas for calculating total payouts, so you can easily manage your compensation plans and make sure everyone gets paid accurately. With a template, you will have all the information at hand when it comes to setting up a successful sales compensation plan. It can be useful in helping to streamline the process of managing sales commissions and tracking employee performance more efficiently.
Additionally, with this template, you'll be able to understand exactly how each employee is performing, enabling you to make better decisions on their compensation plans. You will have a comprehensive overview of your sales team's performance and be able to ensure that everyone is paid fairly and accurately.
With a Sales Compensation Plan Excel Template, you can easily manage the different commission structures for each employee, allowing you to make the most out of your team's performance.
Download the Sales Compensation Plan Excel Template for Free.

An e-commerce demand forecasting Excel template is a spreadsheet tool that helps businesses predict future customer demand for particular products or services. It uses detailed data analysis and predictive analytics, such as historical sales figures, market trends, and competitor performance, to generate forecasts.
The template contains various tools and functions that enable users to easily customize the model according to their own organizational needs and objectives. With this information, businesses can adjust marketing strategies accordingly and make informed decisions on how best to allocate resources.
Additionally, an e-commerce demand forecasting Excel template can be used to analyze current market conditions in order to better understand customer behavior and what drives purchases in certain markets or locations. By understanding these dynamics, businesses are able to design more effective campaigns that will result in higher sales and increased customer loyalty.
Ultimately, an e-commerce demand forecasting Excel template helps businesses make informed decisions about their future products, services, and strategies. With accurate and up-to-date data, they can better plan for customer demand and ensure their continued success in the e-commerce industry.
Download the E-commerce Demand Forecasting Excel Template for Free.

An operating budget Excel template is an easy-to-use spreadsheet that helps you create a detailed plan for managing your business finances. It outlines expected income, expenses, and savings over a period of time. This type of budgeting tool allows you to analyze your current financial position and plan for the future. With the help of a template, it's easier to identify areas for improvement and make changes to reduce costs or increase revenue.
An operating budget also helps you determine if there are any gaps in your cash flow and create strategies to address them. By having an accurate picture of what's coming in and going out each month, you can make better decisions about how to manage your money. Having an operating budget Excel template handy will give you greater peace of mind and help you manage your finances with confidence.
This type of budget template helps to keep track of all the necessary information like income, expenses, and project costs. It also provides you with easy-to-understand charts and graphs that help to visualize your financial data. With an operating budget Excel template, you can quickly and accurately analyze your financial data and make informed decisions about your finances.
It's also a great way to stay organized and on top of your business finances. With the help of an operating budget Excel template, you can easily monitor trends in your finances and create strategies to maximize returns and minimize costs. By taking advantage of an operating budget Excel template, you can ensure that your business is on a sound financial footing and reducing risk.
Download the Operating Budget Excel Template for Free.

A Capitalization Table Excel Template is a useful tool for startups and early-stage companies. It helps you keep track of the company’s equity ownership structure and value, as well as any changes that occur over time. It can also be used to compare different financing scenarios, determine optimal terms and negotiate with investors.
The template typically consists of an Excel spreadsheet that contains columns detailing the names of shareholders, their ownership percentages, the overall percentage ownership of all shareholders combined, the total number of shares outstanding, convertible notes or preferred stock details, and liquidation preferences. This information allows business owners to make more informed decisions regarding their capital structure and investment opportunities.
By using a Capitalization Table Excel Template, entrepreneurs can easily assess the financial position of their business and make decisions that are informed by the current financial structure. It’s also a great way to keep track of events that could potentially affect their company’s value, such as a major acquisition or the release of new products. This tool can help entrepreneurs make sure their company is on the right track for continued growth.
Overall, a Capitalization Table Excel Template provides entrepreneurs with an easy and convenient way to track and manage their company’s equity value, ownership structure, and financing options. By utilizing this powerful tool, entrepreneurs can gain a better understanding of their company’s financial position and make more informed decisions.
Download the Capitalization Table Excel Template for Free.
Hady has a passion for tech, marketing, and spreadsheets. Besides his Computer Science degree, he has vast experience in developing, launching, and scaling content marketing processes at SaaS startups.
Layer is now Sheetgo
Automate your procesess on top of spreadsheets.
Upmetrics AI Assistant: Simplifying Business Planning through AI-Powered Insights. Learn How
Entrepreneurs & Small Business
Accelerators & Incubators
Business Consultants & Advisors
Educators & Business Schools
Students & Scholars
AI Business Plan Generator
Financial Forecasting
AI Assistance
Ai pitch deck generator
Strategic Planning
See How Upmetrics Works →
- Sample Plans
- WHY UPMETRICS?
Customers Success Stories
Business Plan Course
Small Business Tools
Strategic Canvas Templates
E-books, Guides & More
Free Business Plan Template for Excel
Ajay Jagtap
- October 31, 2023
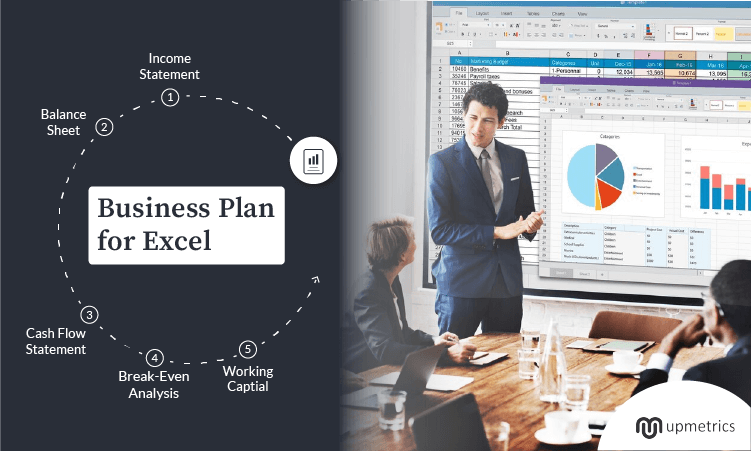
With 1 in 8 people using Excel, I’d be hard-pressed to believe that anyone has never used it at some point in life.
While we have all used it at least once—be it for school homework, college assignments, or travel planning—we never really got the hang of it.
(Excel formulas are tough!)
Preparing a business plan from scratch using Excel is not a joke; we get that. That’s why we created this business plan template in Excel .
So, no more worrying about Excel formulas or plan structure—download the document and follow the instructions in the article for successful business planning.
Sounds good? Let’s start with understanding the pros and cons of using Excel for planning:
Pros and Cons of Using Excel for Business Plans
Before we head to discussing the Excel business plan template, let’s understand the pros and cons of using Excel for business planning:
- Free to use: MS Excel is 100% free for all its users, making it a cost-effective choice.
- Data Analysis: Excel is a powerful tool for performing various financial and data analyses and calculations.
- Collaboration: Collaborating with your team while working on a project using Excel is easier.
- Lack of automation: Excel may not help create dynamic business plans with automated features.
- Limited presentation: Excel cannot create an appealing business plan like a business plan software.
- Complex formulas: Excel’s formulas are complex and require a significant learning curve to master.
So these were the pros and cons. Let’s cut to the chase and discuss the key components of our free business plan Excel template.
Key Components of Our Excel Business Plan Template
It’s a fact—you cannot use Excel to create the entire plan from scratch, no! Excel is a powerful tool for complex calculations and analyses; let’s use it for that only.
So, we’ll use this business plan Excel template only to perform complex financial analyses and calculations—to prepare financial projections.
Following are the critical components of a good business plan template you must include in your financial plan:
1. Income Statement
The income statement is one of the key financial statements of your financial plan that highlights its profit and loss over a given period of time.
The critical components of your income statement include—revenue/sales, Cost of Goods Sold (COGS), operational costs, EBITDA, interest, and others.
Say goodbye to old-school Excel sheets & templates
Build your business plan faster and easier with AI
Plans starting from $7/month

2. Balance Sheet
Your balance sheet is a statement that reports your company’s assets, liabilities, and shareholder equity, providing a snapshot of its financial position at a specific period of time.
The statement helping you calculate financial ratios includes the following:
- Assets—e.g. Inventory, cash, property.
- Liabilities—e.g. Accounts payable, loans, salaries to be paid.
- Owners equity—e.g. Capital investment/contribution.
3. Cash Flow Statement
The cash flow statement of your financial plan is the projection of your cash in and outflows over a certain period of time.
As one of three key components of your financial plan, the cash flow statement summarizes the amount of cash or cash equivalents entering or leaving your company.
4. Break-Even Analysis
A break-even analysis helps you determine the number of units you need to sell to cover all fixed and variable costs.
The break-even point is considered a measure of safety margin, and anything you sell beyond the point will result in profit.
While your balance sheet already highlights the assets, liabilities, and owner’s equity, assets are considered critical for investors to assess the company’s financial health. So, our simple business plan template (Excel) has a separate sheet for business assets.
6. Accounts Payable & Receivable
The accounts payable refer to the amount due to vendors or suppliers for services or goods received, whereas accounts receivable represent the money due to the company.
The increase or decrease in your accounts payable or receivable can be seen in your cash flow statement.
7. Working Capital
Working capital is the subtraction of your current liabilities from your current assets. As a critical element in identifying your company’s health, it helps investors understand if it has enough capital to pay employees and fund operations to meet short-term goals.
Download the Financial Forecast Template In Excel
We discussed all the critical statements to be covered in your financial plan. Now what? It’s time for you to download the financial forecast template and start preparing your financial plan.
Unlike other free Excel templates, this template has all the reports with the suggested revenue streams, expenses, and other details.
You can directly download and use the template to forecast cash flow, create balance sheets, and prepare income statements that provide detailed information about your revenue and expenses. So what are you waiting for?
How to Use an Excel Business Plan Template
We’re hoping you’ve already downloaded the business plan template. So, the question arises: How can this Excel template be used to prepare realistic forecasts?
Let’s get this over with:
Understand the template structure
Before you start planning, you must understand the structure of the financial portion of your business plan. Get a thorough review of the template and understand:
- What critical statements does it include?
- What are the revenue streams?
- What are considered to be assets and liabilities?
- What does the taxation structure look like?
And others. Once you thoroughly understand the structure, you can move ahead with the next step.
Analyze historical data
Financial forecasting is about assumptions—a lot of them, but accurate ones. If you’re a total stranger to financial forecasting, analyzing historical data will help you get off on the right foot.
Analyze the historical data and try to gain insights about your business financials:
- Monthly revenue over the last year?
- How much you’re spending on day-to-day operations?
- What is your sales growth rate? How fast is it increasing over time?
And others. These historical figures will be of massive help in the next step.
Make pre-assumptions
As I said before, financial forecasts heavily rely on certain assumptions like sales forecasts, operational expenses, revenue growth, and others.
So, in this step, you’ll make assumptions about these variables based on the historical data to make them realistic and accurate.
Prepare key financial reports
Once you have made pre-assumptions, it’s time to prepare forecasts. Don’t overwhelm yourself with a lot of numbers; start by preparing critical financial reports that include—a cash flow statement, balance sheet, and income statement.
Other statements of your plan rely heavily on these reports, so the process will become much easier after having prepared these three beforehand.
Monitor and track progress
After preparing your financial reports, the next step is timely monitoring these reports and tracking progress.
You can compare your assumptions with actual results to see if your projections are accurate and relevant to the changing market trends.
Analyzing metrics like customer acquisition rate, acquisition costs, net profit, and gross margin will help track progress.
If you follow these steps rigorously, you can surely make a decent plan to support your business strategies and achieve financial goals.
Still, it was just about financial planning. What about the entire business plan? Excel is a no-go for business planning; let’s see why.
How Excel may not be the best choice for business planning?
Since Excel doesn’t offer all the necessary features for business planning that a business plan software like Upmetrics would, it is not the tool to be used to create a comprehensive business plan.
Following are a few reasons why Excel may not be a better choice for business planning compared to a tool like Upmetrics:
- Limited features: Since it is not designed specifically for planning, it has limited business planning features compared to software like Upmetrics. A business planning software may include features like business plan builder, financial forecasting, and pitch deck creator.
- Limited collaboration: Everyone knows Excel isn’t the tool with the best collaboration features. Business plan software offers collaboration features, allowing multiple team members to work on a business plan simultaneously.
- No Automation: Upmetrics comes with many automation features like AI assistant and financial forecasting tool, helping entrepreneurs and small businesses save time and reduce human errors.
- No customizable templates: Upmetrics has 400+ business plan examples and templates that make it easier for new users to get started, which has not been the case with Excel.
These were just a few of many reasons why a planning tool is a better alternative than Excel to create a comprehensive plan to support their business strategy.
Improve Your Business Financial Plan with Upmetrics
I’d surely have recommended Excel for financial planning if you had asked maybe a decade ago.
Today? There’s no way Excel stands a chance when competing with a cutting-edge AI business planning solution like Upmetrics.
Upmetrics simplifies business planning with its library of business templates, financial forecasting tool, and AI-powered assistant, making it a much more efficient alternative to Excel.
What are you waiting for? Start planning today!
Make your plan in half the time & twice the impact with Upmetrics
Fill-in-the-blanks, AI-assistance, and automatic financials make it easy.

How do i create a business plan in excel.
It’s challenging to draft an entire business plan in Excel. However, you can use Excel to create the financial portion of your plan using a free business plan Excel template. A ready-made template is always better and faster than preparing your financial reports from scratch.
Are there any alternatives to Excel for creating a business plan?
Yes, there are a few alternatives to Excel for creating a business plan. However, using a business plan software like Upmetrics would be a better alternative to creating a business plan than others.

Why should I use an Excel template for my business financial plan?
You cannot certainly master Excel formulas in one day, and preparing advanced financial reports from scratch means you must be very good at accounting, budgeting, and Excel sheets and ready to spare some intense hours.
So, considering the complexity of Excel—using a ready-made template seems like a great starting point for budding entrepreneurs with no financial planning experience.
Are there any free business plan templates available in Excel?
Although it’s tough to create the entire business plan in Excel from scratch, Upmetrics offers a free business plan Excel template to help you gain inspiration and make the financial portion of your business plan.
Can I share my financial plan online with others using Excel?
Yes, you can share your financial plan online with others using Excel. To share your document with others, simply click on the “Share with People” option and enter their email addresses, and you have shared the doc.
About the Author

Ajay is a SaaS writer and personal finance blogger who has been active in the space for over three years, writing about startups, business planning, budgeting, credit cards, and other topics related to personal finance. If not writing, he’s probably having a power nap. Read more
Reach Your Goals with Accurate Planning
No Risk – Cancel at Any Time – 15 Day Money Back Guarantee
Popular Templates
Ready to kickstart your business planning.
– Don’t Miss It
- Financial Statements

The Vertex42™ collection of financial spreadsheets includes templates designed specifically for small business owners . We hope that you will find them as useful as we have! The spreadsheets featured below also work with OpenOffice and Google Spreadsheets, so if you are operating your business on a very tight budget, hopefully you'll be able to make these financial templates work for you.
Financial Statement Templates
Business plan workbook ▶.
Create a business plan using Word with a companion Excel workbook for customizing financial statements.
Balance Sheet Template ▶
Summarize what your company owns and owes. Compare to previous year(s).
Income Statement Template ▶
Provides a measure of economic performance for your company. Also called a Profit and Loss Statement
Cash Flow Statement Template ▶
Where does your company get and spend its cash?
Business Budget Template ▶
Contains two worksheets for creating a yearly business budget - for service providers or companies producing and selling goods. Based on the Income Statement template, with similar categories and layout.
12-Month Business Budget ▶
Create a 12-month breakdown of your sales and business expenses.
Business Budget and COGS Analysis ▶
Perform a detailed analysis of expenses and cost of goods sold (COGS) for multiple products.
Break Even Analysis Calculator ▶
Calculate the Break-Even Point or Payback Period for a new venture or product.
Profit and Loss Projection Template ▶
Based on the Business Budget template - helps you create a 3-year profit and loss projection.
Sales Forecast Template ▶
Create a sales forecast spreadsheet to use in your business plan, including estimated sales, COGS, and gross profit on a monthly basis over 3 years. Includes sample charts.
Business Startup Costs Template ▶
Estimate the startup costs for your new business. Essential for any business plan.
Depreciation Schedule Template ▶
Calculate yearly depreciation for multiple assets using the straight-line or declining balance methods.
Billing Statement Template ▶
A billing statement can be used as an invoice as well as an accounts receivable ledger. This works well as a customer account statement. It can also be used to bill a customer.
Personal Financial Statement ▶
Create and maintain your own personal financial statements, including a balance sheet for calculating net worth and a cash flow statement for budgeting.
Net Worth Calculator for Excel ▶
Calculate your net worth based on the total of all your assets minus your liabilities.
Petty Cash Log Template ▶
Customize and print a petty cash form for your business. Includes a reconciliation section.
SWOT Analysis Template ▶
Use a SWOT Analysis to routinely evaluates the health or your business or personal finances and find ways to grow and improve.
Waterfall Chart Template ▶
Create a horizontal or vertical waterfall chart using Excel.
More Financial Statements
- NPV Calculator - A simple spreadsheet to help calculate Net Present Value and Internal Rate of Return of various investments.
- Financial Management Templates at templates.office.com - The new Microsoft Office® templates gallery has a few financial statements.
Follow Us On ...
- Budget Templates
- Business Templates
- Data Analysis
- Debt Payoff
- Financial Calculators
- Health Charts & Logs
- Home and Family
- Lists / Checklists
- To Do Lists
- Loan Calculators
- Mortgage Calculators
- Project Management
- Savings & Retirement
- Schedules / Planners
- Timeline Templates
- Timesheets & HR
- Numbers Templates
Original text

Access our collection of user-friendly templates for business planning, finance, sales, marketing, and management, designed to assist you in developing strategies for either launching a new business venture or expanding an existing one.
You can use the templates below as a starting point to create your startup business plan or map out how you will expand your existing business. Then meet with a SCORE mentor to get expert business planning advice and feedback on your business plan.
If writing a full business plan seems overwhelming, start with a one-page Business Model Canvas. Developed by Founder and CEO of Strategyzer, Alexander Osterwalder, it can be used to easily document your business concept.
Download this template to fill out the nine squares focusing on the different building blocks of any business:
- Value Proposition
- Customer Segments
- Customer Relationships
- Key Activities
- Key Resources
- Key Partners
- Cost Structure
- Revenue Streams
For help completing the Business Model Canvas Template, contact a SCORE business mentor for guidance
From creating a startup budget to managing cash flow for a growing business, keeping tabs on your business’s finances is essential to success. The templates below will help you monitor and manage your business’s financial situation, create financial projections and seek financing to start or grow your business.
This interactive calculator allows you to provide inputs and see a full estimated repayment schedule to plan your capital needs and cash flow.
A 12-month profit and loss projection, also known as an income statement or statement of earnings, provides a detailed overview of your financial performance over a one-year period. This projection helps you anticipate future financial outcomes by estimating monthly income and expenses, which facilitates informed decision-making and strategic planning.
If you’re trying to get a loan from a bank, they may ask you for a personal financial statement. You can use this free, downloadable template to document your assets, liabilities and net worth.
A Personal Financial Statement is a
Marketing helps your business build brand awareness, attract customers and create customer loyalty. Use these templates to forecast sales, develop your marketing strategy and map out your marketing budget and plan.
How healthy is your business? Are you missing out on potential growth opportunities or ignoring areas of weakness? Do you need to hire employees to reach your goals? The following templates will help you assess the state of your business and accomplish important management tasks.
Whether you are starting your business or established and looking to grow, our Business Healthcheck Tool will provide practical information and guidance.
Learn how having a SCORE mentor can be a valuable asset for your business. A SCORE mentor can provide guidance and support in various areas of business, including finance, marketing, and strategy. They can help you navigate challenges and make important decisions based on their expertise and experience. By seeking out a SCORE mentor, you can gain the guidance and support you need to help grow your business and achieve success.
SCORE offers free business mentoring to anyone that wants to start, currently owns, or is planning to close or sell a small business. To initiate the process, input your zip code in the designated area below. Then, complete the mentoring request form on the following page, including as much information as possible about your business. This information is used to match you with a mentor in your area. After submitting the request, you will receive an email from your mentor to arrange your first mentoring session.
Copyright © 2024 SCORE Association, SCORE.org
Funded, in part, through a Cooperative Agreement with the U.S. Small Business Administration. All opinions, and/or recommendations expressed herein are those of the author(s) and do not necessarily reflect the views of the SBA.
5-Year Financial Plan Template
Whether you are already running a business, or making plans to start one up, financial planning is a vital part of ensuring your success. Not knowing your expected income and expenditure will make it difficult to plan, and hard to find investors.
This 5-Year Financial Plan spreadsheet will make it easy for you to calculate profit and loss, view your balance sheet and cash flow projections, as well as calculate any loan payments you may have. Whilst the wording on this spreadsheet is focussed around products, it can just as easily be used for businesses who largely provide services to their customers.
5-Year Financial Plan Projection

How to use Financial Plan
Model inputs.
Use the Model Inputs sheet to enter information about your business that will be used to model results seen on the other pages.
Forecasted Revenue
The forecasted revenue section allows you to estimate your revenue for 4 different products. Simply use the white boxes to enter the number of units you expect to sell, and the price you expect to sell them for, and the spreadsheet will calculate the total revenue for each product for the year. If you want to give your products names, simply type over the words "Product 1", "Product 2" etc. and these names will be carried through to the rest of the spreadsheet.
Cost of Goods Sold
Your margins are unlikely to be the same on all of your products, so the cost of goods sold allows you to enter your expected gross margin for each product into the white boxes in Column B. The spreadsheet will automatically calculate the annual cost of goods sold based on this information, along with your forecasted revenue.
Annual Maintenance, Repair and Overhaul
As the cost of annual maintenance, repair and overhaul is likely to increase each year, you will need to enter a percentage factor on your capital equipment in the white box in Column B. This will be used to calculate your operating expenses in the profit and loss sheet.
Asset Depreciation
Use the white box to enter the number of years you expect your assets to depreciate over. This may vary greatly from business to business, as assets in some sectors depreciate much more quickly than they do in others.
In most parts of the world, you will have to pay income on your earnings. Enter the annual tax rate that applies to your circumstances in the white box in Column B. If you have to pay any other taxes, these can be entered later on the Profit and Loss sheet.
Although you cannot be certain of the level of inflation, you will still need to try and plan for it when coming up with a 5-year financial plan. The International Monetary Fund provide forecasts for a number of countries, so is a good place to look if you are unsure what to enter here. Simply enter your inflation rate in the white box.
Product Price Increase
As a consumer, you are no doubt aware that the price of products goes up over time. Enter a number in the white box to show the expected annual price increase of your products to enable the spreadsheet to calculate income in future years. If you are unsure what to put here, increasing your product price in line with inflation is a good starting point. If your business is just starting out, you may be able to command higher prices for your products or services as the years go on, as you build up brand recognition and a good reputation.
The funding section allows you to enter information about your business loan. To use this section, simply fill in the three white boxes representing the amount of the loan, the annual interest rate and the term of the loan in months - for example, 12 for 1 year, 24 for 2 years, 36 for 3 years, 48 for 4 years, or 60 for a 5 year loan.
This sheet calculates your profit and loss for each year over a 5 year period. The profit and loss assumptions, along with income, are automatically calculated using information entered in the model inputs sheet.
Non-Operation Income
You may have, or be expecting some income in addition to your operating income. These can be entered manually in the white cells in Column B for Year 1, Column C for Year 2 and so on. There are pre-entered categories for rental, lost income and loss (or gain) on the sale of assets, as well as an additional row where you can enter your own non-operation income.
Operating Expenses
Some parts of this are already filled in based on information you put on the Model Inputs, for example, depreciation, maintenance and interest on long-term debt. Years 2-5 are also filled in for you across all categories based on the inflation information entered in the Model Inputs sheet. You therefore only need to enter your Sales and Marketing, Insurance, Payroll and Payroll Tax, Property Taxes, Utilities, Administration Fees and any Other Expenses into the white cells in Column B for Year 1.
Non-recurring Expenses
This section is for entering any expenses that you will not be paying on an annual basis. The Unexpected Expenses row allows you to enter a contingency for unexpected expenses, whilst the Other Expenses row allows you to enter any other one off expenses you may be expecting to make, for example the purchase of new equipment part way into your 5 year plan.
Income Tax is filled in based on the information you enter into the model inputs. Depending on where your business is based, you may find yourself having to pay other taxes. These can be entered in the Other Tax row. You can rename this row by typing over the "Other Tax (specify)" text.
Balance Sheet
The annual balances for Years 1-5 are, in most cases, filled in for you, based on the information you have entered on the Model Inputs sheet and in the Initial Balance column of the Balance Sheet column itself. This makes it very easy to use.
Current Assets
This is where you can enter the value of any of your current assets, with spaces to enter information about Cash and Short-term Investments, Accounts Receivable, Inventory, Prepaid Expenses and Deferred Income Tax. At the bottom of this section is a space for you to enter any other current assets you may have that do not fall into any of these categories.
Property and Equipment
Depending on the nature of your business, you may have assets such as Buildings, Land, Capital Improvements and Machinery. Enter the value of these assets into Column B, and these values will be copied over to each of the 5 years of the plan. The depreciation information entered into the Model Inputs sheet will be used to calculate the depreciation expenses, which allows a total for property and equipment to be calculated automatically.
Other Assets
This section is for entering information on any assets that don't fit in the other sections. These could be Goodwill Payments, Deferred Income Tax, Long-term Investments, Deposits, or any Other long-term assets. Enter the information into Column B, and it will be carried across to the yearly columns automatically.
Current Liabilities
As well as assets, your business is likely to have liabilities. There are spaces to enter Accounts Payable, Accrued Expenses, Notes Payable and Short-term Debt, Capital Leases and Other current liabilities. Just leave blank any rows where you do not have any liabilities, and the totals will be calculated for you.
Your long-term debt/loan information will have already been entered in the Model Inputs sheet, so the only thing to do here is to enter any other long-term debt. Unlike much of the rest of the Balance Sheet, you can manually enter different amounts for each year, as you may, for example, be expecting to take on another loan to purchase some new equipment in Year 3 as your business expands.
Other Liabilities
Use this section to enter any liabilities not covered by the pre-defined labels. You can amend the text in Column A, in order to specify the liabilities, and then enter the cost of these liabilities in Column B.
Your business is likely to have some equity, and this can be entered into this section. You can fill out the Owner's Equity, Paid-in Capital and Preferred Equity in Column B. Your retained earnings are automatically calculated based on the Profit and Loss sheet.
Much of the information on the cash flow sheet is based on calculations in the Balance Sheet. It is important to plan your cash flow carefully, so that you know what funds you will have available to buy new stock and equipment.
Operating Activities
Much of this section is automatically filled in based on your balance sheet. There are only three rows to fill out, which are Amortization, Other Liabilities and Other Operating Cash Flow. You only need to fill out the white boxes in Column B for Year 1, as these values will automatically be carried over into subsequent years for you.
Investing Activities
Your capital expenditures and sale of fixed assets will be automatically populated if you have filled out the relevant sections of the Balance Sheet. They will be blank if they do not apply. As investing activities can vary year on year, you will need to fill out any investment activities for each of the 5 years in the appropriate columns for Acquisition of Business, and any Other Investing Cash Flow items.
Financing Activities
The long-term debt/financing row will be pre-filled based on the loan information previously entered. Use Column B to fill out your Preferred Stock, Total Cash Dividends Paid, Common Stock and Other Financing Cash Flow items for Year 1. This information will automatically carried over to Years 2-5.
Loan Payment Calculator
There is nothing to enter on this sheet, as it is for information only. Whether or not you already have a loan, or are using this spreadsheet as a part of a business plan to help you obtain one, it allows you to easily see how much you will be paying each month, showing how much you are paying off your loan, and how much you are paying in interest. This will allow you to get an idea of whether or not you can afford to borrow a bit extra, if you feel it would allow you to push your business into higher places, or whether you need to shop around for a better interest rate or adjust the loan term in order to afford the loan payments.
Related Templates

14 Best Excel Templates for Business in 2024 (Free & Premium)
- Last updated March 21, 2024
Fact Checked By Cindy Wong
Let’s talk about Excel templates. These pre-made spreadsheets help you improve productivity quickly. In this comprehensive guide, we’ll dive deep into the world of Excel templates, equipping you with the knowledge and tools to streamline your tasks, boost productivity, and make informed decisions.
From understanding what Excel spreadsheet templates are to exploring specialized templates for various industries, we’ve got you covered. Whether you’re a seasoned Excel user or just starting, our friendly yet professional approach will simplify complex concepts and empower you to harness the full power of Excel templates.
What Are Excel Templates?
We provide a host of spreadsheet templates for our readers. And Excel templates are no exception. These pre-designed spreadsheets created to simplify various tasks and processes. They serve as starting points, offering predefined structures, formulas, and formatting. These templates are designed to save you time and effort by eliminating the need to build spreadsheets from scratch.
Key Features of Excel Spreadsheet Templates
- Structured Layout: Templates come with organized rows and columns tailored to the specific task or use case. For instance, a budget template might include categories for income, expenses, and savings.
- Predefined Formulas and Functions: Excel spreadsheet templates often include formulas and functions that perform calculations automatically. For example, a mortgage calculator template may already have formulas for calculating monthly payments and interest.
- Formatting and Styling: Templates feature consistent design, including fonts, colors, and cell borders. This makes your data visually appealing and easy to read.
- Placeholder Data: Templates often contain placeholder data or instructions to guide you in entering your information. These placeholders help you understand how to use the template effectively.
- Customizability: While templates provide a structured framework, they are highly customizable. You can modify them to suit your specific needs by adding or removing columns, changing labels, or adjusting formulas.
Common Uses of Excel Templates
- Budgeting: Excel templates for budgeting help individuals and businesses manage their finances effectively by tracking income and expenses, projecting future financial goals, and analyzing spending patterns.
- Project Management: Project management templates assist in planning, tracking, and managing projects. They often include Gantt charts, task lists, and progress trackers.
- Data Analysis: Excel offers templates for data analysis, such as pivot tables, allowing you to quickly summarize and analyze large datasets.
- Accounting: Accounting templates help businesses maintain accurate financial records, including ledgers, income statements, and balance sheets.
- Inventory Management: Inventory templates help businesses track stock levels, monitor product sales, and manage inventory turnover.
Types of Excel Templates
Excel spreadsheet templates come in various categories, each designed to address specific needs and tasks. Here are some of the most common types of Excel templates:
Financial Excel Templates
Financial templates are geared towards managing finances, budgeting, and financial analysis. You can make your own cash flow template , or use one that’s already made. Common financial spreadsheets include:
- Budget Templates: These templates help individuals and businesses create and manage budgets, ensuring that income and expenses are balanced. Check out our top budget templates for Google Sheets .
- Financial Models: Financial modeling templates are used for forecasting financial performance, especially in business planning and investment analysis.
- Income Statements: Templates for income statements track revenues and expenses to determine profitability.
- Balance Sheets: These templates provide a snapshot of a company’s financial position by displaying assets, liabilities, and equity.
Project Management Excel Templates
Project management templates are essential for planning, executing, and monitoring projects. For example, we covered our favorite project status report templates . Other common templates include:
- Gantt Charts: Gantt chart templates visually represent project schedules, showing tasks, timelines, and dependencies.
- Project Timelines: These templates offer a simplified view of project milestones and deadlines.
- Task Tracking Templates: Task tracking templates help teams assign, track, and manage tasks to keep projects on schedule.
Data Analysis Excel Templates
Data analysis templates are invaluable for individuals and businesses working with data. Key templates include:
- Pivot Tables: Pivot table templates simplify data summarization and analysis, allowing users to create interactive reports.
- Data Visualization Templates: Templates for charts and graphs help transform raw data into visual representations for easier understanding.
- Statistical Analysis Templates: Statistical analysis templates include tools for performing statistical tests and calculations.
Personal and Business Excel Templates
Personal and business templates cover a wide range of tasks. We have an article that covers payment receipt templates . Other common personal and business spreadsheets include:
- To-Do List Templates: These templates help you stay organized by listing tasks and priorities.
- Invoice Templates: Invoice templates streamline the invoicing process for businesses, including itemized lists and payment tracking.
- Business Plan Templates: Business plan templates provide structured frameworks for creating comprehensive business plans, helping startups and established companies alike.
Whether you’re managing finances, overseeing a project, analyzing data, or organizing personal tasks, Excel templates offer a time-saving solution to enhance your productivity.
Top 14 Excel Templates for Business
Now, let’s delve into the top Excel templates that can significantly boost your productivity across various domains. We’ll explore each template, highlighting its key features and benefits.
Financial Management Excel Templates
1. financial model.
The Financial Model Excel template is a versatile tool designed to help businesses of all sizes and types manage their finances effectively. Whether you’re a business, a startup , or operating in specific niches like SaaS , E-Commerce , or Marketplace , this template offers comprehensive financial projections, including income statements, balance sheets, and cash flow statements. It’s essential for budgeting, forecasting, and making informed financial decisions.

- Accurate Projections: Generate precise financial projections for different business scenarios, aiding in strategic planning.
- Scenario Analysis: Easily assess the impact of various decisions on your financial health by running multiple scenarios.
- Investor-Ready: Impress investors and stakeholders with professional financial reports and insights.
- Data Visualization: Utilize charts and graphs to visualize financial trends and make data-driven decisions.
Price: $74-139 (Use code SPoint10 for 10% off)
2. Profit and Loss Statement
The Profit and Loss Statement Excel template is tailored to specific business models, including startups , marketplaces , SaaS , and E-Commerce ventures. It helps you track your revenues, costs, and expenses to calculate your net profit or loss accurately. With clear and customizable categories, you can gain a deep understanding of your business’s financial performance.
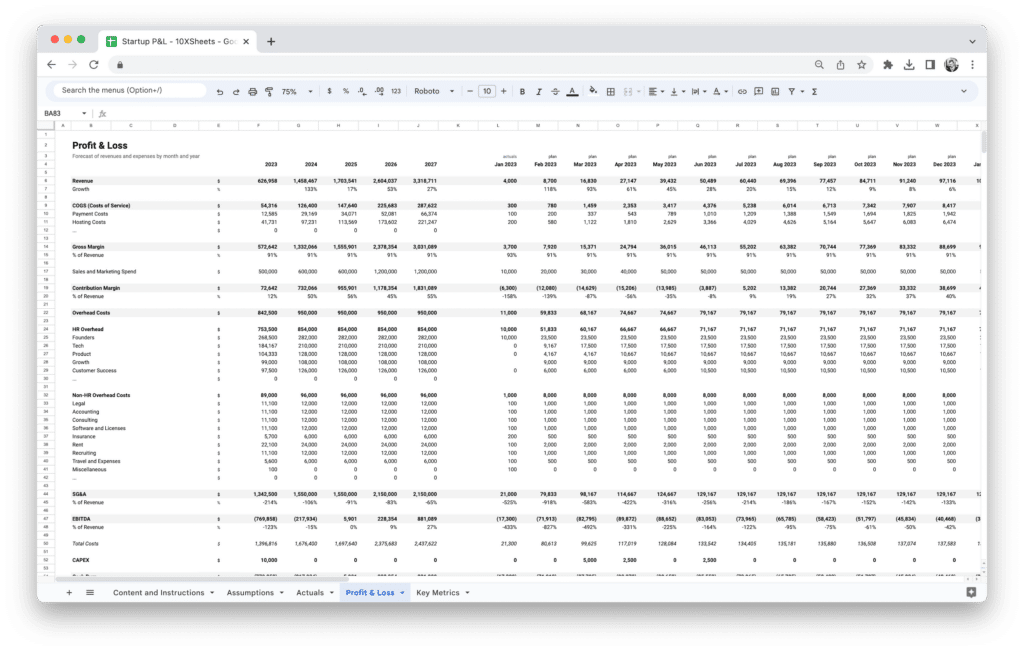
- Business-Specific Tracking: Choose a template that aligns with your business model for precise financial insights.
- Expense Categorization: Easily categorize expenses for better cost management and identification of cost-saving opportunities.
- Year-over-Year Comparison: Track your financial performance over time to identify growth trends or areas that need improvement.
- Tax Preparation: Simplify tax preparation by neatly organizing your income and expenses.
Price: $74 (Use code SPoint10 for 10% off)
3. Revenue Forecasting Tool
The Revenue Forecasting Tool Excel template is indispensable for businesses focused on revenue growth. With different versions tailored to Marketplace , SaaS , E-Commerce , and Agency models, it enables you to project your future revenues based on historical data, market trends, and growth strategies. This tool empowers you to set realistic revenue targets and make informed decisions to achieve them.
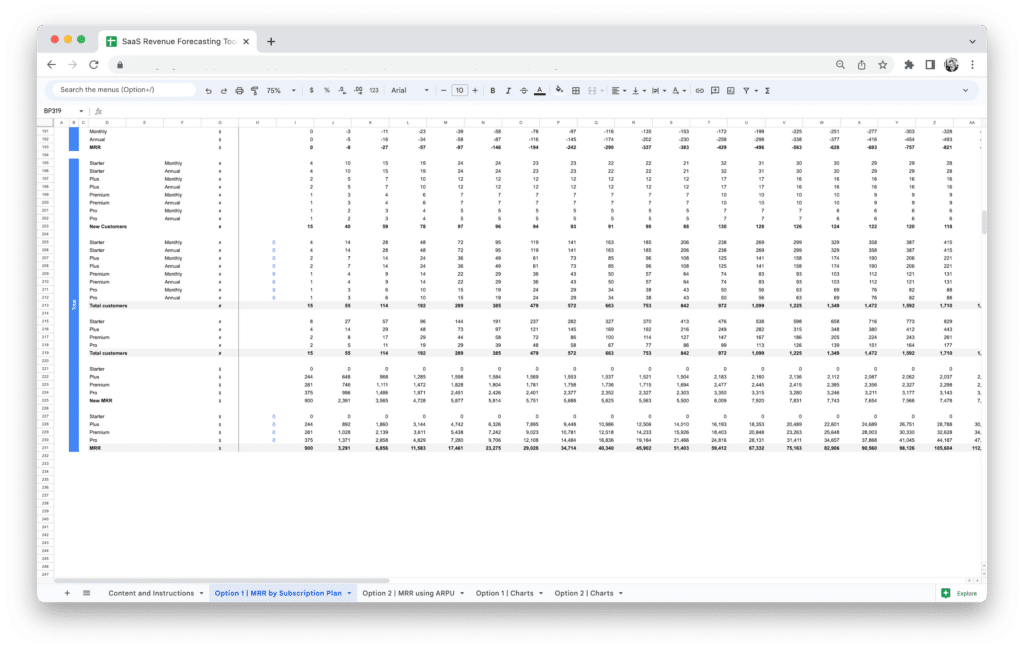
- Data-Driven Projections: Utilize historical data and market insights to generate accurate revenue forecasts.
- Goal Setting: Set achievable revenue targets and track progress towards your financial goals.
- Scenario Planning: Assess how changes in pricing, marketing, or sales strategies impact revenue.
- Informed Decision-Making: Make strategic decisions backed by comprehensive revenue projections.
Price: $46 (Use code SPoint10 for 10% off)
Budgeting and Tracking Excel Templates
4. zero-based budget template.
Zero-based budgeting is a meticulous approach to budgeting where you allocate every dollar of your income to expenses, savings, or investments. The Zero-Based Budget Excel template simplifies the zero-based budgeting process, ensuring that your budget accurately reflects your financial priorities and goals.
- Financial Clarity: Gain a clear understanding of where your money goes and prioritize spending according to your goals.
- Savings and Investments: Systematically allocate funds for savings, investments, and debt reduction.
- Expense Tracking: Monitor daily expenses to identify areas for potential savings.
- Emergency Fund Planning: Create a buffer for unexpected costs by including an emergency fund category.
Price: $4.99
5. Inventory and Sales Tracking Template
Managing inventory and tracking sales is crucial for businesses, especially those in retail or e-commerce. The Inventory and Sales Tracking Excel template streamlines inventory management, allowing you to efficiently track stock levels, sales, and product performance.
- Real-Time Inventory: Monitor inventory levels in real-time, ensuring you never run out of stock or overstock products.
- Sales Analysis: Analyze sales data to identify top-performing products and optimize your product offerings.
- Cost Control: Keep tabs on inventory costs and prevent financial losses due to mismanagement.
- Data-Driven Decision-Making: Use sales insights to make informed decisions about restocking, promotions, and pricing strategies.
Price: $19.99
6. Capital Expenditure Planning Template
Capital expenditures (CapEx) are essential for businesses looking to grow and invest in assets like equipment, technology, or infrastructure. This free CapEx Excel template simplifies the planning and tracking of capital expenditures, ensuring efficient allocation of resources.
- Streamlined Planning: Plan and prioritize capital expenditures in a structured manner.
- Budget Control: Stay within budget by tracking expenses against planned allocations.
- ROI Assessment: Evaluate each capital expenditure’s return on investment (ROI) to make informed decisions.
- Asset Management: Keep a comprehensive record of your business’s assets and their depreciation.
Price: Free!
Investment and Financial Analysis Excel Templates
7. simple investment template.
The Simple Investment Excel template is perfect for individuals or businesses looking to analyze potential investments. It assists in evaluating the financial feasibility of investments, calculating returns, and making informed investment decisions.
- Investment Evaluation: Assess the attractiveness of various investment opportunities.
- Risk Analysis: Consider the risks associated with each investment and their impact on returns.
- Return Calculations: Calculate potential returns, including net present value (NPV) and internal rate of return (IRR).
- Decision Support: Make well-informed investment choices based on financial analysis.
8. Mortgage Calculator with Amortization Table
Mortgages are a significant financial commitment. This Mortgage Calculator Excel template simplifies mortgage calculations, helping individuals and homeowners understand their loan terms, amortization schedules, and total interest payments.
- Loan Clarity: Understand your mortgage terms, including interest rates, monthly payments, and loan duration.
- Amortization Schedule: View the full amortization schedule, tracking principal and interest payments over time.
- Interest Savings: Explore strategies for paying off your mortgage early to reduce interest costs.
- Financial Planning: Incorporate mortgage payments into your long-term financial planning.
9. CLV vs. CAC Analysis Template
Customer Lifetime Value (CLV) and Customer Acquisition Cost (CAC) are critical business metrics. The CLV vs. CAC Analysis Excel template simplifies the calculation and analysis of CLV and CAC, aiding in strategic marketing and growth decisions.
- Customer Profitability: Determine the profitability of acquiring and retaining customers.
- Marketing Efficiency: Evaluate the effectiveness of marketing campaigns by comparing CAC to CLV.
- Retention Strategies: Identify opportunities to increase CLV through customer retention and loyalty programs.
- Data-Driven Marketing: Allocate marketing budgets more efficiently based on CLV and CAC insights.
Data Analysis and Metrics Tracking Excel Templates
10. cohort analysis template.
Cohort analysis is a powerful method for examining user behavior over time. The Cohort Analysis Excel template simplifies the process, helping businesses gain insights into customer retention, engagement, and more.
- User Segmentation: Group users into cohorts based on signup date or other criteria for focused analysis.
- Retention Insights: Identify trends in user retention and pinpoint when users drop off.
- Product Improvement: Use cohort analysis to inform product improvements and marketing strategies.
- Churn Reduction: Develop strategies to reduce customer churn based on cohort analysis findings.
11. MRR Dashboard Template
Monthly Recurring Revenue (MRR) is a vital metric for subscription-based businesses. The MRR Dashboard Excel template provides a comprehensive dashboard for tracking MRR, analyzing trends, and making data-driven decisions.
- MRR Overview: Get a real-time overview of your MRR, including new revenue, lost revenue, and net MRR growth.
- Churn Analysis: Identify reasons for churn and implement strategies to reduce it.
- Growth Tracking: Monitor your subscription business’s growth and set goals for MRR expansion.
- Data Visualization: Visualize MRR trends with charts and graphs for easier interpretation.
12. User Engagement Dashboard Template
User engagement is critical for online businesses. The User Engagement Dashboard Excel template provides a user-friendly dashboard for tracking user engagement metrics, analyzing user behavior, and optimizing user experiences.
- Comprehensive Metrics: Track key engagement metrics such as session duration, bounce rate, and conversion rate.
- Segmentation: Analyze user engagement based on demographics, devices, or referral sources.
- Content Performance: Identify high-performing content and optimize the user journey accordingly.
- Conversion Optimization: Implement strategies to improve user engagement and conversion rates based on insights.
Business Planning and Management Excel Templates
13. software license management tool.
The Software License Management Excel tool simplifies the process for businesses managing software licenses. It allows you to track software licenses, renewal dates, and compliance, ensuring efficient software management.
- License Tracking: Easily keep track of all software licenses in use across your organization.
- Renewal Alerts: Identify license renewals timely to prevent interruptions.
- Cost Control: Avoid unnecessary software purchases and optimize license utilization.
- Compliance Assurance: Ensure compliance with software licensing agreements to avoid legal issues.
14. Workforce Planning Tool
Effective workforce planning is crucial for businesses of all sizes. The Workforce Planning Excel template streamlines the process by helping you manage employee information, staffing levels, and workforce optimization.
- Employee Database: Maintain a centralized employee information database, including roles, qualifications, and contact details.
- Staffing Analysis: Analyze staffing levels and plan for hiring, training, or restructuring as needed.
- Cost Projections: Estimate labor costs and budgets for workforce expansion or reduction.
- Scenario Planning: Model various workforce scenarios and their financial implications.
These Excel spreadsheet templates cover a wide range of business and financial needs, making them invaluable tools for improving productivity, making informed decisions, and achieving your goals. Whether you’re a financial analyst, business owner, or simply looking to better manage your finances, Excel templates offer a user-friendly and robust solution.
Best Practices for Excel Templates
Excel spreadsheet templates are powerful tools that can significantly enhance your productivity , but it’s essential to follow best practices to make the most of them. Here are some tips and strategies to help you use Excel templates effectively.
Choose the Right Template
Selecting the appropriate template for your specific task is the first step to success. Consider the following factors when choosing a template:
- Task Complexity: Ensure the template aligns with the complexity of your task. Simple tasks may require basic templates, while more complex tasks need advanced templates.
- Customizability: Look for templates that allow customization. Templates that are too rigid may not suit your unique needs.
- Industry or Use Case: Many templates are designed for specific industries or use cases. For financial tasks, for instance, choose templates tailored to your industry, such as retail, healthcare, or real estate.
- Scalability: If your task may grow in complexity or data volume, opt for a template that can scale with your needs.
Understand Formulas and Functions
Excel templates often come with built-in formulas and functions to automate calculations. To use these templates effectively, it’s crucial to understand how these formulas work.
- Learn the Basics: Familiarize yourself with common Excel functions like SUM, AVERAGE, IF, VLOOKUP, and more. These are the building blocks of many templates.
- Review Formulas: Take time to review the formulas used in the template. Understand how they calculate results and what data they depend on.
- Customize Formulas: If needed, customize formulas to suit your specific requirements. Modify cell references or add new calculations as necessary.
Input Data Accurately
Accurate data input is essential to obtain meaningful results from Excel spreadsheet templates.
- Double-Check Data: Ensure all data entered into the template is accurate and error-free. A slight mistake can lead to significant inaccuracies in calculations.
- Use Data Validation: Implement data validation rules to prevent incorrect data entry. Excel can prompt users when data doesn’t meet specified criteria.
- Consistent Formatting: Maintain consistent formatting throughout the template. This includes date formats, number formats, and currency symbols.
- Document Data Sources: Keep track of your data sources, especially if you’re pulling data from external sources. This documentation can help troubleshoot discrepancies later.
Regularly Save and Backup
Excel templates represent valuable work, so protecting your data is essential.
- Frequent Saving: Save your work regularly to prevent data loss in case of unexpected software crashes or power outages.
- Version Control: Maintain version control by saving different iterations of your template. Use meaningful file names and dates to track changes.
- Backup Files: Implement a backup strategy. Regularly create copies of your Excel files and store them in a secure location, whether it’s a cloud service or an external drive.
Understand Template Limitations
Excel spreadsheet templates have limitations, and it’s essential to be aware of them.
- Data Volume: Excel may not handle very large datasets efficiently. Consider using a database or specialized software for extensive data management.
- Complexity: Templates have limits in terms of complexity. You might need to consider custom software or consulting with a specialist for more advanced or intricate tasks.
- Data Security: Be cautious when handling sensitive or confidential data within Excel. Implement password protection and encryption where necessary.
Customize for Your Needs
While templates provide a structured starting point, don’t hesitate to customize them to better suit your unique requirements.
- Add or Remove Fields: Include additional or remove unnecessary fields to streamline data entry and reporting.
- Format and Styling: Adjust the template’s formatting and styling to match your preferences and branding guidelines.
- Automate Repetitive Tasks: Excel allows you to automate repetitive tasks using macros. Learn how to create and use macros to save time.
Stay Updated and Educated
Excel is a continually evolving software, and staying updated with the latest features and best practices can benefit your productivity.
- Software Updates: Keep your Excel software up-to-date to access new features and security patches.
- Online Resources: Explore online resources, spreadsheet tutorials , and forums to expand your Excel skills and troubleshoot issues.
- Advanced Training: Consider advanced Excel training courses or certifications to become an Excel power user.
By following these best practices, you can harness the full potential of Excel spreadsheet templates, streamline your tasks, and make more informed decisions. Excel templates are versatile tools that can save you time and effort, but mastering them requires a combination of knowledge, practice, and attention to detail.
Get Started with the Financial Spreadsheet Template Bundle
Ready to take control of your finances and make smart financial decisions? Our Financial Spreadsheet Template Bundle is the ultimate solution to simplify financial management, investment analysis, and mortgage planning.
This bundle includes five powerful templates that can help you achieve your financial goals with ease:
- Cryptocurrency Portfolio Tracker: Keep track of your cryptocurrency investments, monitor real-time market prices, and analyze your portfolio’s performance effortlessly.
- Inventory and Sales Tracking Spreadsheet Template: Optimize your business operations with this template. Efficiently manage inventory, track sales, and make data-driven decisions.
- Simple Investment Template: Make informed investment choices by analyzing potential returns and risks. This template simplifies investment planning for beginners and experts alike.
- Extra-Payment Mortgage Calculator: Take control of your mortgage payments and reduce the total interest you pay. This tool helps you plan extra payments to pay off your mortgage faster.
- Mortgage Calculator Spreadsheet with Amortization Table: Understand your mortgage terms, visualize your amortization schedule, and make sound financial decisions regarding homeownership.
Purchasing these templates individually would cost you more than $69, but with the Financial Spreadsheet Template Bundle , you can access all of them at a fraction of the price. Save over 40% off the list price and embark on your journey to financial success today!
Price: $39.99
Excel templates are your secret weapon for accomplishing tasks faster and more efficiently. With the right template at your fingertips, you can conquer financial challenges, manage projects like a pro, and analyze data with ease. The best part? You don’t need to be an Excel expert to reap the benefits. These templates are designed to simplify your life and make complex tasks feel like a breeze.
So, whether you’re tracking expenses, planning a project, or diving into data analysis, remember that Excel spreadsheet templates are your trusty companions on the journey to productivity and success. Embrace them, customize them, and watch your tasks transform from daunting to doable. Excel templates are your shortcut to getting things done, and the possibilities are endless. Start using them today and take control of your tasks, one spreadsheet at a time!
Free Multiple Project Tracking Template for Excel (2 Options)
Most Popular Posts

How To Highlight Duplicates in Google Sheets
How to Make Multiple Selection in Drop-down Lists in Google Sheets

Google Sheets Currency Conversion: The Easy Method
A 2024 guide to google sheets date picker, related posts.
How to Easily Track Changes in Excel [Legacy Guide for 2024]
- Chris Daniel
- March 28, 2024
Master the Excel Consolidate Feature in 10 Mins [Free Guide]
- March 21, 2024
The 5 Best Excel Project Management Templates
- March 14, 2024
Thanks for visiting! We’re happy to answer your spreadsheet questions. We specialize in formulas for Google Sheets, our own spreadsheet templates, and time-saving Excel tips.
Note that we’re supported by our audience. When you purchase through links on our site, we may earn commission at no extra cost to you.
Like what we do? Share this article!
Free Startup Plan, Budget & Cost Templates
By Kate Eby | September 12, 2017
- Share on Facebook
- Share on LinkedIn
Link copied
A business plan describes how a new business will meet its primary objectives over a given period of time. It is both a strategic document that can act as a roadmap and a tool for securing funding and communicating with stakeholders. For a startup business, planning is key to developing a thorough understanding of the target market, competition, market conditions, and financing opportunities.
Included on this page, you'll find a variety of helpful, free startup business planning templates , like a SWOT analysis template , a competitive analysis template , a business startup checklist template , and more.
Startup Business Planning Templates
Competitive analysis template - excel.
Download Competitive Analysis Template
Excel | Smartsheet
Analyze multiple competitors based on the categories you want to compare, and use the results to identify your top rivals. This template contains several sheets to provide a comprehensive look at how your startup stacks up to the competition, the strengths of each company, and potential partnerships or opportunities.
SWOT Analysis Template - Excel
Download SWOT Analysis Template
While researching your business plan, both risks and opportunities are likely to arise. This critical information gives you the chance to plan for how you will take advantage of or address them as needed. A SWOT analysis helps you identify and gain a clear understanding of internal strengths and weaknesses as well as external opportunities and threats. The results of the analysis will inform your business goals and strategies for reaching them. Once completed, you can add this SWOT template to a startup business plan or use it as a planning tool. If this template doesn’t have the details you require, you can find more of our free SWOT Analysis Templates .
Marketing Plan Template - Excel
Download Marketing Plan Template
Easily create a detailed marketing plan for different campaigns, including projected and actual costs. It also doubles as a marketing calendar template, showing a weekly, monthly, and quarterly breakdown of your timeline and initiatives. A marketing plan is typically part of a business plan, but you can use this dedicated template for developing a thorough plan and schedule.
Business Startup Checklist Template - Excel
Download Business Startup Checklist Template
This template offers a simple checklist to help you organize all of the tasks that need to be accomplished, from initial research and planning to establishing professional partnerships and acquiring necessary permits. Edit the list to include relevant actions for a particular business. This is an easy way to ensure that important items are not overlooked and prioritize steps.
Business Planning Schedule - Excel
Download Business Planning Schedule
This template allows you to create a schedule for tasks with a visual calendar for planning. This layout can help you organize your planning process and provide a timeline for reaching certain milestones. The template is structured around planning stages, allowing you to separate tasks hierarchically. To use this template for another planning process, simply edit the tasks included and add your dates to the schedule.
Target Market Comparison Template - Excel
Download Target Market Comparison Template - Excel
Utilize this worksheet to compare target markets in order to understand which are ideal for your product or service. Understanding your customers is vital not only for developing effective strategies, but also for showing investors that you’ve done the necessary research and understand how to reach potential customers.
Startup Business Plan Template - Word
Download Startup Business Plan Template
Word | Smartsheet
This template offers a traditional outline for creating a business plan document. You’ll find sections for an executive summary, company description, marketing plan, product and operational information, financial data, and room for appendices. You can refine the plan to suit different industries and business types. For example, if you want to create a technology startup business plan template, you will want to show how the startup will deal with rapidly changing markets, and provide product and market research that shows how your business will be on the cutting edge. You may also need to provide longer-term financial projections since high-tech startups often operate for an extended time without profits.
For additional resources, visit " Free Startup Business Plan Templates and Examples ."
One-page Business Plan Template - Word
Download One-page Business Plan Template
Excel | Word | PDF | Smartsheet
Create a streamlined business plan document on a single page with this Word template. A simplified plan can be helpful for summarizing information into a brief report. This format gives readers a quick overview of your startup business plan while emphasizing key points.
For additional resources, visit " One-Page Business Plan Templates with a Quick How-To Guide ."
Startup Financial Templates
Small-business budget template - excel.
Download Small-Business Budget Template
This basic budget is ideal for small businesses that want an easy, blank template to customize. To create a business budget, include both fixed and variable expenses along with revenue and funding sources. Use this template to track expenditures and revenue, maintain a balanced budget, and to help grow your business.
Sales Forecast Template - Excel
Download Sales Forecast Template
With this template, you get a 12-month sales forecast as well as sales data from prior years. You can organize the spreadsheet based on product names, target customers, or other categories, and then enter forecasted monthly sales, including adjustments for seasonal changes or other factors that might impact sales. The template also calculates monthly and yearly totals.
Business Startup Costs Template - Excel
Download Business Startup Costs Template
Startup costs begin to accrue before operations begin, so it’s important to determine expenses early on to avoid being underfunded or overspending. This startup costs template shows a summary of both funding and expenses at the top, with itemized details below. You can use this worksheet to outline expenses, create a tentative budget, and compare actual costs as they accrue. Similar to a start up budget template, this version helps you focus on expenditures.
Startup Budget Template - Excel
Download Startup Budget Template
A startup budget is an important tool for identifying what financial resources are available, determining how much revenue is needed to meet business goals, and pinpointing areas where you can save money. A budget works as a planning tool as well as a method for tracking actual expenditures. As part of a business plan, it supports the process of pitching to investors and completing loan applications. This budget template is geared toward startup companies and includes a section for projected monthly costs.
Startup Financial Projections Template - Excel
Download Startup Financial Projections Template
Similar to a pro forma template for startups, this version includes a 12-month profit and loss projection, a balance sheet, and a cash flow statement. Use the template to analyze the current financial standing and run a future forecast for a business. The spreadsheet includes pre-populated fields with expenses and income sources, which you can easily edit to accommodate your business.
Personal Financial Statement - Excel
Download Personal Financial Statement
Some lenders may require a personal financial statement in addition to relevant business data. This template lists assets and liabilities in order to calculate net worth. You’ll also find space for adding a signature so you can certify that the information is correct.
Balance Sheet Template - Excel
Download Balance Sheet Template
This template can be modified to either show an opening day balance for a startup or to create a projected balance sheet. Choose a given time period, enter your numbers for assets, liabilities, and equity, and the template will provide automatic calculations.
First-Year Budget Calculator - Excel
Download First-Year Budget Calculator
Combining business and personal budget information into a single template can be useful for small business owners who are just getting started. This template focuses on first-year budget calculations including startup costs, operating expenses, estimated income, personal expenses, and more. You can identify fixed and recurring costs for a full view of expenses for the first year.
12-Month Cash Flow Forecast - Excel
Download 12-Month Cash Flow Forecast
This template shows all 12 months of the year for a monthly and annual cash flow forecast. In addition to creating a forecast, you can compare actual cash flow totals for each month. The template is divided into categories for cash on-hand, cash receipts, and cash paid-out, with an alternating color scheme for easy viewing.
Annual Business Budget Template - Excel
Download Annual Business Budget Template
As a startup becomes established, this template can be used to create a budget showing totals on a monthly, quarterly, and annual basis. You can create a projected 12-month budget as well as compare financial data to the previous year’s performance. The template provides detailed income and expense categories for thorough planning and tracking.
Financial Dashboard Template - Excel
Download Financial Dashboard Template - Excel
Create a visual financial report with this dashboard template, which tracks statistics over time using graphs and charts. Compare sales rep performance, product revenue, regional data, or other financial KPIs. A graphical report provides a quick overview of financial information in a format that is easy to understand and share with stakeholders.
Marketing Budget Plan - Excel
Download Marketing Budget Plan
Create a dedicated marketing budget with results displayed in both a spreadsheet format and pie chart. Calculate costs for various marketing campaigns in order to view fund allocation. The template includes space for comments and notes to aid in strategic business planning.
Website Budget Template - Excel
Download Website Budget Template
This startup website template provides sections for calculating initial development costs as well as creating a projected budget over three years. View a list of costs and benefits to see how the website will impact the business over time. This template can help you determine the value of your website investment and track actual annual performance.
Loan Amortization Schedule - Excel
Download Loan Amortization Schedule
Keep track of a loan balance, payments made, upcoming amounts due, and interest paid with this loan amortization template. Enter lender information and loan terms at the top of the template, and then use the schedule to track payment details. Startups owners will appreciate how easy it is to manage business loans and create repayment plans.
Why Write a Startup Business Plan?
The benefits of writing a startup business plan range from clarifying initial ideas to attracting potential investors. The process of business planning can help uncover weaknesses as well as opportunities you may have overlooked. Planning encourages entrepreneurs to examine each step required to start a business in order to avoid mistakes in the long run. Collecting data through market analysis can allow you to confidently make informed decisions and provide a dose of reality to your business idea by affirming or challenging initial assumptions about your product, business model, or strategies for achieving success. Once you clarify your startup vision, analyze financial and market data, and define goals, you can create a strategic action plan to use as a guide for reaching objectives and addressing potential challenges.
After establishing a startup, continue business planning to identify ways to grow and improve the business as well as to plan for resource use and development. If you treat your business plan as a living document that you regularly review and update, you can also use it to measure progress over time. An effective plan communicates a company’s vision to team members and all stakeholders, and provides both a foundation and an adaptable model that can grow and change along with the business.
One key reason for startups to develop sound business plans is to convince investors and lenders to finance the endeavor. Most banks and investors will want to see detailed financial projections and a statement of your current personal and business financial standing. Investors may want to see market data and other proof that your plan has a high chance for success. Without adequate financing, no startup can succeed, so it’s essential to create an ironclad pitch for funders.
What to Include in a Business Plan
Business plans are tailored to fit a specific type of business and to serve a particular purpose, whether it’s to seek funding, influence a particular audience, or develop strategy for internal use. While you’ll need to continually revise plans need to fulfill a certain function, there are similar elements in all business plans. Here are some of the common sections included in a startup business plan:
- Summary and Objectives: This first section can provide background information, a detailed company description, general industry information, goals that you want to achieve, and long-term objectives. Depending on the size and type of business, this information may be divided into multiple sections or summarized in one pitch.
- Marketing Plan: Providing market data and an outline for how you will market and sell products and services allows you to show a deep understanding of your target audience and your plans for branding and distribution. Be sure to conduct thorough research that you can use to back up your plans with supporting numbers and statistics. You may also include separate, detailed sections on competition, customer characteristics, product features, sales forecasts, and marketing strategy.
- Operational Plan: This section is concerned with the equipment, processes, and people involved in daily operations. You may want to include details on location requirements, production methods, legal issues (such as licenses or insurance requirements), staffing information, vendor needs, and other operational elements.
- Management and Organization: A description of management positions and professional advisors provides an organized look at key roles, the experience individuals bring to the business, and important consultants or mentors. You can also include resumes for key employees and startup owners if the business plan is supporting a loan application or investor pitch.
- Startup Expenses and Financial Plan: Estimate expenses as accurately as possible and include contingencies for unforeseen costs. Creating estimates requires thorough research, and expenses should include even small items - while they are easy to overlook, they may add up to significant costs. A comprehensive financial plan can include profit and loss projections and other budget forecasts in order to provide a clear picture of a startup’s financial standing and future outlook.
A business plan will, of course, look different for a restaurant, web-based business, technology service provider, or product manufacturer. Before getting started, consider what you want to accomplish with your business plan, and customize it accordingly.
Business Plan Tips
Taking the time for thorough research and planning can help you make informed decisions, avoid potential pitfalls, and craft an effective plan. Here are a few tips to consider as you create a business plan:
- Get Creative: Business plans can follow a simple outline, but turning your plan into a creative presentation can make a statement and grab investors’ attention.
- Use Data Wisely: No matter what format or approach you take, a startup business plan should be concise and include compelling evidence and hard data to back up your claims.
- Refine Your Plan: Consider your audience and review your plan to ensure the information presented is appropriate, sufficient, and clear.
- Focus on Objectives: Connect every strategy to core objectives so that there is a clear path for attaining success.
Manage All Aspects of Your Startup in Real Time with Smartsheet
Empower your people to go above and beyond with a flexible platform designed to match the needs of your team — and adapt as those needs change.
The Smartsheet platform makes it easy to plan, capture, manage, and report on work from anywhere, helping your team be more effective and get more done. Report on key metrics and get real-time visibility into work as it happens with roll-up reports, dashboards, and automated workflows built to keep your team connected and informed.
When teams have clarity into the work getting done, there’s no telling how much more they can accomplish in the same amount of time. Try Smartsheet for free, today.
Discover why over 90% of Fortune 100 companies trust Smartsheet to get work done.
This financial plan projections template comes as a set of pro forma templates designed to help startups. The template set includes a 12-month profit and loss statement, a balance sheet, and a cash flow statement for you to detail the current and projected financial position of a business. . Download Startup Financial Projections Template.
Our business plan excel template includes the following sections: Income Statement: A projection of your business' revenues, costs, and expenses over a specific period of time. Includes sections for sales revenue, cost of goods sold (COGS), operating expenses, and net profit or loss. Example 5 Year Annual Income Statement.
A business plan template is a structured framework for entrepreneurs and business executives who want to create business plans. It comes with pre-arranged sections and headings that cover key elements like the executive summary , business overview, target customers, unique value proposition, marketing plans, and financial statements.
Structure of worksheets: Make sure that most worksheets are set up with the same structure. For example, start with a headline in cell B2, years starting in column H, content in row 10. Layout / format of cells: Make sure you use a consistent formatting. For example, Excel provides cell styles - use them.
Financial management Keeping your finances in check is easy to start-and maintain- when you use an Excel budget planning template in your financial management routine. Customize an Excel template to suit your unique financial management needs, whether you're balancing the books of a small business or keeping track of your household budget.
Download the Template: Start by downloading our free Business Plan Excel template. Input Your Data: Enter your business data into each sheet. Each section comes with clear instructions on what information is needed. Analyze and Plan: Use the data you've entered to analyze your current business situation, make projections, and develop ...
Easy-to-use Excel financial models for serious entrepreneurs. Profit and loss. Cash flow statement. Balance sheet. Business valuation (DCF) 20+ charts and metrics. See all financial models.
Download these templates from the Office Templates site to create your plan: Fill in your Business plan. Analyze your market with the Business market analysis template. Detail your financials in a Financial plan. Divide up the work and track deliverables with this Business plan checklist. Wrap up with this Business startup checklist.
FinModelsLab provides a wide range of industry-specific financial model templates in Excel as well as Excel dashboards, Business Plan Templates, and Pitch Deck Templates. Creating a business plan with detailed financial projections and pitch deck presentation or Excel dashboard is time-consuming. That is why we created a web repository with ...
With a Runway and Cash Budget Template, businesses can gain greater insight into their financial situation and make sure that they are always prepared for the future. Download the Runway and Cash Budget Excel Template for Free. 6. Balance Sheet Template. Download the Balance Sheet Excel Template for Free.
The business plan financials Excel template automatically creates a cash flow statement and a statement of sources/uses of funds. The model links them to the numbers from the income statement and the balance sheet. So, even if you are a seasoned professional financial modeler, you will benefit from using the template as it will save several ...
This template provides a business plan outline with sample questions, tables, and a working table of contents. It was created for newer versions of Word and Excel (Office 2007 or later) so that you can easily change the fonts and color scheme and the file will be compatible with the mobile and web-based Word & Excel apps. It is best to use ...
Excel is a powerful tool for complex calculations and analyses; let's use it for that only. So, we'll use this business plan Excel template only to perform complex financial analyses and calculations—to prepare financial projections. Following are the critical components of a good business plan template you must include in your financial ...
Financial Statements. The Vertex42™ collection of financial spreadsheets includes templates designed specifically for small business owners. We hope that you will find them as useful as we have! The spreadsheets featured below also work with OpenOffice and Google Spreadsheets, so if you are operating your business on a very tight budget ...
Finance Templates. From creating a startup budget to managing cash flow for a growing business, keeping tabs on your business's finances is essential to success. The templates below will help you monitor and manage your business's financial situation, create financial projections and seek financing to start or grow your business. Template.
Fill in the form to get your tool. It's 100% free. We allow you to use these templates only as part of your business activities, but we do not guarantee that they fit your needs. Unfortunately, we do not offer any assistance. You are responsible for the content of the documents you create using these templates.
Download a free 5-Year Financial Plan template, which helps when planning a launch of a new products with involvement of a long-term financing. 5-Year Financial Plan includes, Profit and Loss, Balance Sheet, Cash Flow and Loan Amortization.
Download a Blank Financial Forecast Template for. Excel | Google Sheets. This template is perfect for businesses that require a detailed and all-encompassing forecast. Users can input various financial data, such as projected revenues, costs, and market trends, to generate a complete financial outlook.
6. Capital Expenditure Planning Template. Capital expenditures (CapEx) are essential for businesses looking to grow and invest in assets like equipment, technology, or infrastructure. This free CapEx Excel template simplifies the planning and tracking of capital expenditures, ensuring efficient allocation of resources.
A Coffee House Business Plan Example illustrates a roadmap for opening a coffee shop. It includes market analysis, operational strategies, and financial projections. Diving into the world of specialty coffee shops requires a solid foundation and a clear business strategy. Crafting a comprehensive business plan is the first step toward ...
Download Annual Business Budget Template. Excel | Smartsheet. As a startup becomes established, this template can be used to create a budget showing totals on a monthly, quarterly, and annual basis. You can create a projected 12-month budget as well as compare financial data to the previous year's performance.
amadeus sailing yacht
New on boatsatsea.
- Mischievous
- The Blue Dream

NEWEST SPECIAL OFFERS
- Adeona ( Lastminute 30% off )
- Royal Flush ( Jun 20% off )
- Aquarella ( 10% off)
- Aquila ( 5% off)
- Ulisse ( 10% off)
- Boom ( 10% off)
- See All Special Offers
TOP CHARTER YACHTS
- Crystal Dreams ( 15% off)
- Bella ( $1,000 off)
- See All Yachts
Most Searched Yacht
Ad astra 5.4.
From $28,500 per week
TOP DESTINATIONS
- Virgin Islands (BVI & USVI)
- Leeward Islands / St. Martin
- Windward Islands / Grenadines
EUROPE / MEDITERRANEAN
- Amalfi Coast & Sicily
- Riviera & Corsica & Sardinia
- Spain / Balearics
- New England
- South America
MY FAVORITE YACHTS
- See Favorite Yachts
- Send & Share Favorite Yachts
- Empty Favorite Yacht List
- Yacht Charter FAQ
- Rates Explanations
- Concierge Service
- Customer Satisfaction
- BoatsAtSea Reviews
- Dedicated Support
Privacy Policy
- Cookie Policy
Amadeus - Crewed Sailing Yacht Charter
Amadeus €35,000.

Amadeus Image 1/22
Layout of Amadeus
Amadeus Image 3/22
Amadeus Image 4/22
SUNBATHING FORWARD
SUNBATHING FORWARD ANOTHER VIEW
- Splash Pool
Splash Pool another view
Amadeus Image 9/22
Amadeus Image 12/22
Amadeus Image 13/22
Amadeus Image 14/22
Amadeus Image 15/22
Amadeus Image 19/22
Amadeus Image 20/22
Anastasia Yurash (Asst. Stewardess)
Stelios Mandos (Engineer)
- From €35,000 / week
- Sailing Monohull + 6 crew
- Summer Port: Cruising Areas Summer: Greece, Turkey Summer Port: Marina Zea, Piraeus, Greece Winter: Greece Winter Port: Marina Zeas, Pireaus, Greece ">Marina Zea, Piraeus, Greece
- Winter Port: Cruising Areas Summer: Greece, Turkey Summer Port: Marina Zea, Piraeus, Greece Winter: Greece Winter Port: Marina Zeas, Pireaus, Greece ">Marina Zeas, Pireaus, Greece
- Length: 110 ft / 33.5 meters 110 feet 33.5 meters
- Guests: 12 in 5 cabins
- Builder: Dynamique Ya
- Built: 1996 / Refit: 2014/2020
- Offers Rendezvous Scuba Diving only
Plus Expenses
- Reviews (1)
Amadeus Description
Built by the famous Dynamique Yachts shipyard, and having undergone a total refit in 2018, S/Y Amadeus was designed to please the most demanding of yachtsmen. Built for smooth sailing, this elegant cutter rigged sloop has a sleek hull design, comfortably reaching top speeds of 12 knots and ensuring excellent sailing performance. S/Y Amadeus has just undergone this past winter (2018) a major refit such as total repaint top to bottom, new rigging (BSI Denmark), Novourania with new Evinrude 75hp outboard, Splash pool, new Bimini/Sprayhood/Awnings, new exterior fabrics and many other enhancements. In 2016 new “North Sails” were placed onboard. The yacht is maintained in excellent condition with a five-star crew year round. Her generous uncluttered teak deck offers plenty of space for sunbathing. The spacious and unique outdoor saloon has two tables seating upto 12 guests and is a perfect setting for outdoor dining and entertainment. Thanks to a special canopy and roll-up windows, the deck saloon has the added attraction that it can be fully enclosed, making it ideal for all weather conditions. Her forward area includes a splash pool and sun bathing area which can also be shaded with a removable awning. From the cockpit, a stairway leads to the light-filled spacious saloon offering ample seating, ideal for relaxing or enjoying a drink from the bar, and offers a formal dining area. This area also includes a LCD TV, entertainment center, ipod dock station, playstation, and is ideal for indoor activities. She can accommodate 10-12 guests in one full width master stateroom, two double bedded cabins each having one extra single bed and two twin bedded cabins which can be easily converted to double beds (upon request), thus, making her the only 5 double bedded sailboat in the Greek market. She also has a nice selection of toys which include water ski (adult and children), tubes, inflatable canoes, wakeboard, fishing rod and snorkeling gear.
Cruising Area of Amadeus
Accommodations, specification, water sports, scuba diving, entertainment, amadeus crew profile, chief stewardess.
CAPTAIN - Harry Fotopoulos Captain Harry is a graduate of the Merchant Marine Academy and holds a Captain Class A’ Diploma. He also holds a Canadian Commercial Pilot license class B, sailing and speedboat license. He has over 15 years of experience onboard many types of Charter Yachts. He holds Certificates in GMDSS, Fire Fighting & First Aid, Personal Safety, Life Saving, and Ship Security. He has a great knowledge of the Greek islands and will navigate guests to remarkable destinations. During his one season on board he showed great leadership skills and received positive feedback from all guests. He is calm yet very outgoing and speaks very good English. DECKHAND - Konstantinos Santas CHIEF STEWARDESS - Mirella Davint Mirella has 8+ years of experience as a stewardess onboard charter and private yachts. She has a very pleasant personality and she aims to accommodate her guests to the fullest. Comments received from previous guests are memorable. This will be Mirella’s eighth season onboard. Mirella speaks English and she is 38 years old. ENGINEER - Stelios Mandos Stelios holds an Engineer Class B’ Diploma from the Greek Merchant Marine Academy as well as a Sailor’s License. He has over 15 years of experience onboard Ocean-Going Vessels and Charter Yachts. His hobbies include spearfishing and sailing. He speaks good English. Stelios is 45 years old, married with two children. CHEF - Thanasis Kiritsis Thanasis is 39 years old and has worked as a chef for more than 20 years in numerous hotels restaurants, yachts and resorts including owning his own pastry shop / bakery for 5 years. Thanasis looks forward to welcoming his guests on board and introducing them to his culinary world. He speaks good English and Greek. He is a young chef full of energy, skills and passion towards his job. We are confident that he will serve his guests unforgettable flavors. ASSISTANT STEWARDESS - Anastasia Yurash Anastasia is 31 years old and has been in the yachting industry since 2021. Her working experience includes 7 years as a housekeeper and assistant stewardess. Anastasia speaks very good English. One of Anastasia’s strongest attributes is her appetite for work. She is also very sociable, welcoming and looks forward to having guests on board S/Y Amadeus. Her hobbies include Latin dancing, snowboard and yoga.
Amadeus Calendar
Amadeus reservations & port locations, amadeus rates / week, low price: €35,000, high price: €42,500, additional rate details, amadeus guest reviews, amadeus / charter july 20-27, 2019.
Sent: Wednesday, July 31, 2019 9:02 PM Hi George, client just informed me, that he and his friends were very happy. Good atmosphere on board, excellent crew, good chef and professional service. Yacht in good condition, nice cabins. The proposed itinerary was good. Clients intend to book AMADEUS next summer again. Please send my big thank you to the Captain. Best regards,
Amadeus Sample Menu
Breakfast selections.
Freshly Squeezed Orange And/Or Grapefruit Juice
Selection Of Other Juices Such As Peach, Pineapple, Tomato.
Fresh Milk Cold And/Or Hot.
Freshly Brewed Coffee And/Or Decaf Coffee, Cappuccino, Espresso (Nespresso)
Hot Or Cold Chocolate, Selection Of Teas Served With Lemon, Honey And/Or Milk.
Breads: Plain Croissant, Chocolate Croissant, Brioche, Muffins, Traditional Greek Bread,
Rolls, Pastries, Toast White/Wheat/Rye.
Selection Of Jams And Marmalades Such As Apricot, Strawberry, Rasberry, Orange And Honey.
Selection Of Cheese Such As Emmental, Edam, Gruyere, Kefalotiri, Graviera,
Cream Cheese, Cottage Cheese, Cheese Spread.
Ham, Bacon, Salami, Smoked Turkey, Prosciutto.
Choice Of: Scrambled Eggs, Boiled Eggs, Fried Eggs, Poached Eggs, Omelets.
Eggs And Omelets Are Prepared To Order And Accompanied According To The Guest’s Requests.
Pancakes, Served With Jam, Honey, Maple Syrup, Fruits And/Or Whipped Cream.
Home-Made Carrot Cake.
Selection Of Cereals Such As Corn Flakes, Bran,Rice Crispies , Muesli.
Greek Plain Yoghurt And Fruit Yoghurt.
Fruit Salad, Half Grapefruit, Mixed Berries, Stewed Prunes, Dried Fruits And Nuts.
LUNCH SELECTIONS
Greek Salad With Marinated Anchovy And Extra Virgin Olive Oil
Fresh Talliatele With Mushrooms And Parmesan Chips
Seawolf Fiilet With Vegetables Briam, Fried Caper And Fresh Thyme Panacotta With Ginger
Salad With Radish, Dill, Parsley, Arabic Pita Bread And Soumak
Egg-Plant Napoleon With Feta Cheese And Tomato Couli
Chicken Roll, Cous-Cous With Raisins, Pine Nut And Orange Sauce Walnut Cake With Vanilla Ice-Cream
Salad With Grilled Peach And Apricot And Watermelon Vinaigrette Sauce
Risotto With Red Mullet, Pine Nuts And Sun Dried Tomato
Pork Loin Filled With Naxos Graviere
Halvas (Semolina) With Korinthous Raisins Kai Cinnamon
Salad With Fennel Root, Olives And Orange
Tarte With Goat Cheese And Green Apple
Gurnet Fillet With Lemon Sauce Baby Potatoes And Parsley
Yogurt Mousse With Fresh Vanilla
Watermelon Salad,Feta Onion And Lemon Sauce, Balsamic Vinegar And Extra Virgin Olive Oil
Stuffed Squid With Chocolate Sauce
Tuna Fillet With Orange Confite And Red Wine Sauce
Peach Cheesecake
Green Salad With Smoked Salmon And Salmon Eggs
Mussels With Fresh White Cheese (Anthotiro) And Peppers
Sole Fillet Saute With Spring Onion And Fava (Yellow Split Peas) Fron Santorini Island
Galaktompoureko (Pastry Fillo Filled With Cream) And Orange Couli
Salad With Rocket, Parmezan Flakes, Sun Dried Tomato And Caramel Balsamic Sauce
Grilled Octapus With Chick Peas And Lemon
Anglerfish Stew With Green Talliatele
Tiramisu With Aigina Pistachios
DINNER SELECTIONS
Salad With Cretan Hard Bread , Tomato And Fresh White Cheese (Anthotiro) Grilled Vegetables Napoleon With Mastello (Chios Cheese) Bream Fillet With Crust From Cuttlefish Ink, Artichoke Mousse And Marinated Fennel Root Chocolate Souffle With Ice-Cream
Green Salad With Cottage Cheese, Walnuts And Extra Virgin Olive Oil With Herbs Cabbage Leafs Filled With Shrimps, Cracked Wheat And Egg-Lemon Sauce And Ginger T-Bone Steak With Mushrooms Sauce,Dofinouaze Potato Trifle With Coffee
Caesars Salad With Poached Egg, Parmesan Tuille And Mustard Crackers Fousili With Pesto Sauce And King Prawns Cod Fish Cooked With Safron, Green Olives And Potato Kantaifi With Pistachio And Ice Cream
Mozzarella Buffal0 With Black Eyed Beans And Fennel Rizotto Venere With Chicken Breast And Crawfish Rib-Eye With Fresh Potato Chips And Vegetable Sauce Almond Pie With Chocolate
Baby Spinach Salad, Pears With Pepper And Walnut Vinegar From Blackberry Beef Carpaccio With Caper, Parmesan And Rocket Gilthead Fillet, Vegetable Chips And Hot Balsamic Sauce Greek Loukoumades, Thyme Honey And Walnuts
Cracked Wheat Salad, Parsley,Cucumber,Tomato And Pomegrenade Sauce Goat And Feta Cheese Croquete, Orange And Cumin Sauce Pork Souvlaki, Greek Pita Bread, Tzatziki Sauce And French Fries Caltsounia (Pastry) With Manouri Cheese, Mint, Honey-Orange Sauce
Grilled Vegetables Salad And Chaloumi (Cyprus Cheese) Eggplant “Papoutsakia”, Mince Meat With Fresh Tomato Sauce Spagetti Flavored With Cutlefish Ink, Shrimps Hazelnut Cream Profiterolle
SIMILAR YACHTS
Check out similar yachts to amadeus.
Estrella De Mar
€23,450 / week
Guests in Cabins: 12 / 5
Length: 111.5 ft (34 m)
Summer Port: Bodrum, Turkey
Prices from: €23,450 / week
€50,000 / week
Guests in Cabins: 9 / 4
Length: 100.6 ft (30.65 m)
Summer Port: Athens, Greece
Winter Port: Athens, Greece
Prices from: €50,000 / week
Wind of Change
€24,000 / week
Guests in Cabins: 6 / 3
Length: 95.1 ft (29 m)
Prices from: €24,000 / week
€29,000 / week
Guests in Cabins: 8 / 4
Length: 99 ft (30.2 m)
Winter: Greece
Prices from: €29,000 / week
€43,500 / week
Length: 108.3 ft (33 m)
Summer Port: Lavrio, Greece
Prices from: €43,500 / week
€21,000 / week
Guests in Cabins: 14 / 7
Length: 115.5 ft (35.20 m)
Summer Port: Gocek, Turkey
Winter Port: Gocek, Turkey
Prices from: €21,000 / week

AMADEUS is a fast cruising sailing yacht built by the famous Dynamique Yachts shipyard and totally refit in 2004, she was designed to please the most demanding of yachtsmen. Built for smooth sailing, this elegant cutter rigged sloop has a sleek hull design that enables her to comfortably reach top speeds of 12 knots and ensures excellent sailing performance.
This sailing yacht's generous uncluttered teak deck with a foredeck pool, offers plenty of space for sunbathing. The spacious and unique outdoor saloon has two tables, a bar and barbeque, a perfect setting for outdoor dining and entertainment. Thanks to a special canopy and roll-up windows, the deck saloon has the added attraction that it can be fully enclosed, making it ideal for all weather conditions. From the cockpit, a stairway leads to the light-filled spacious saloon offering ample seating, ideal for relaxing or enjoying a drink from the bar, and a formal dining area with seating for up to 12 guests.
Accomodation is offered for up to 12 guests in 5 spacious cabins: the bow master cabin on AMADEUS features a double bed, vanity unit and generous storage facilities, as well as audio/visual entertainment. The en-suite bath includes a shower and separate large bath. Two double cabins with additional single bunks situated forward. Two twin cabins situated aft. All cabins with en suite facilities and audio/visual entertainment. Crew of 5 in separate quarters.
Special Features :
- Fast cruising sailing yacht - Spacious teck deck, sunbathing areas - Outdoor saloon with a bar and barbecue
Tender: Novourania tender 4.20m with YAMAHA X 70hp plus MERCURY x 10hp
Activities : Wakeboard , Kayak , Snorkeling equipment , Waterskis , Fishing equipment , Monoski , Tender , Tubes .
Summer : East Mediterranean Greece - The Cyclades Islands | Turkey | Greece – The Ionian Islands
Winter : East Mediterranean Greece - The Cyclades Islands | Turkey | Greece – The Ionian Islands
News & publications

SHINE: New yacht for sale!
A simply stunning Swan 58 as only Swan can. The big sister to the 48 she sails phenomenally well and was designed to allow for fast, safe and comfortable Bluewater passage making. This original owner has used her to cruise the Baltic and she has certainly proven herself. She is ready...

JACK: New Central Agency Yacht
Built in 2023, JACK is a sophisticated and comfortable catamaran that embodies a blend of lightweight construction, eco-friendliness, and remarkable performance. Indeed, she is able to achieve remarkable speeds of up to 21 knots in just 20 knots of wind. Her exterior includes a sprawling...

ONYX 2: New sailing yacht for sale!
ONYX 2 offers amazing space and comfort for those onboard to cruise anywhere in the world. She is seaworthy, solidly-built and well-equipped. She accommodates up to 12 guests in 6 cabins and 7 crew in 3 cabins. There is also a fantastic deck house which offers an incomparable interior...
Similar boats for charter

Length : 31.95 m / Passengers : 6
Special features : - Elegant and sophisticated, with classy mahogany interiors- Wide beam and high volume with a vast centre cockpit, large deckhouse and voluminous main...

Length : 30.3 m / Passengers : 8
Special features : - Deck plan designed for easy sailing and comfort both for crew and guests- Maximum flexibility for shading the guest cockpit and the sunbathing area,...

Length : 34.8 m / Passengers : 8
Special features : Tenders:- "Lina": 7.10 m Scanner with 300 HP inboard engine, specially equipped wih bimini and sprayhood, new in 2018- "Mieke": 4.70 m ZAR with 100 HP...

Length : 37 m / Passengers : 8

Length : 35.2 m / Passengers : 6
Special features : - High tech performance sailing yacht- Plumb bow and wide stern for improved performance and stability- Twin rudders for increased responsiveness- Aerodynamic...

Length : 33.7 m / Passengers : 8
Special features : - Five Stars Crew with an outstanding Chef led by Captain Eddy- Best combination of Elegance and High Performance Sailing yacht- New sails ( DFI aramide...

Length : 30.48 m / Passengers : 12
Special features : - Gold medal winner for the RORC Transatlantic 2015, setting a new record. This performance yacht with the sensation of speed and power is equipped with...

Length : 35.36 m / Passengers : 6
Special features : Tender: 115 Hp Yamaha on 15' Rendova

Length : 31.78 m / Passengers : 8
Special features : KEY FEATURES- Awarded the prestigious Quality and Value award at the 2015 World Superyacht Awards- Offers high performance sailing with first class...

Length : 30.2 m / Passengers : 8
Special features : - One of the most elegant SW100- Excellent and experienced crew- Very elegant interiors- Available in West and East Med- Large outdoor spaceTender: 4.30...
- Receive the brochure of this yacht
- FR +33 AC +247 AD +376 AE +971 AF +93 AG +1 AI +1 AL +355 AM +374 AO +244 AR +54 AS +1 AT +43 AU +61 AW +297 AX +358 AZ +994 BA +387 BB +1 BD +880 BE +32 BF +226 BG +359 BH +973 BI +257 BJ +229 BL +590 BM +1 BN +673 BO +591 BQ +599 BR +55 BS +1 BT +975 BW +267 BY +375 BZ +501 CA +1 CC +61 CD +243 CF +236 CG +242 CH +41 CI +225 CK +682 CL +56 CM +237 CN +86 CO +57 CR +506 CU +53 CV +238 CW +599 CX +61 CY +357 CZ +420 DE +49 DJ +253 DK +45 DM +1 DO +1 DZ +213 EC +593 EE +372 EG +20 EH +212 ER +291 ES +34 ET +251 FI +358 FJ +679 FK +500 FM +691 FO +298 FR +33 GA +241 GB +44 GD +1 GE +995 GF +594 GG +44 GH +233 GI +350 GL +299 GM +220 GN +224 GP +590 GR +30 GT +502 GU +1 GW +245 GY +592 HK +852 HN +504 HR +385 HT +509 HU +36 ID +62 IE +353 IL +972 IM +44 IN +91 IQ +964 IR +98 IS +354 IT +39 JE +44 JM +1 JO +962 JP +81 KE +254 KG +996 KH +855 KI +686 KM +269 KN +1 KP +850 KR +82 KW +965 KY +1 KZ +7 LA +856 LB +961 LC +1 LI +423 LK +94 LR +231 LS +266 LT +370 LU +352 LV +371 LY +218 MA +212 MC +377 MD +373 ME +382 MF +590 MG +261 MH +692 MK +389 ML +223 MM +95 MN +976 MO +853 MP +1 MQ +596 MR +222 MS +1 MT +356 MU +230 MV +960 MW +265 MX +52 MY +60 MZ +258 NA +264 NC +687 NE +227 NF +672 NG +234 NI +505 NL +31 NO +47 NP +977 NR +674 NU +683 NZ +64 OM +968 PA +507 PE +51 PF +689 PG +675 PH +63 PK +92 PL +48 PM +508 PR +1 PS +970 PT +351 PW +680 PY +595 QA +974 RE +262 RO +40 RS +381 RU +7 RW +250 SA +966 SB +677 SC +248 SD +249 SE +46 SG +65 SH +290 SI +386 SJ +47 SK +421 SL +232 SM +378 SN +221 SO +252 SR +597 SS +211 ST +239 SV +503 SX +1 SY +963 SZ +268 TC +1 TD +235 TG +228 TH +66 TJ +992 TL +670 TM +993 TN +216 TO +676 TR +90 TT +1 TV +688 TW +886 TZ +255 UA +380 UG +256 US +1 UY +598 UZ +998 VA +39 VC +1 VE +58 VG +1 VI +1 VN +84 VU +678 WF +681 WS +685 XK +383 YE +967 YT +262 ZA +27 ZM +260 ZW +263
Thanks for contacting us. We will get back to you shortly.
Une erreur s'est produite. Merci de rééssayer.
Contact us
Send message

About Amadeus
Charter rates.

specifications
- Length 33.52M (110′)
- Beam 7.53M (25′-4″)
Builder Dynamique Yachts
- Year of build 1996
Tenders & Toys
- Fishing equipment
- inflatable canoes
- On deck pool
- Snorkeling gear
Talk to our experts
Looking for a yacht charter? We’re happy to help! Please call the number below, send an email or contact us via WhatsApp.

Maxim Beckers

Carl-Antoine Saverys
Share this yacht, related yachts for charter.
© EXMAR YACHTING | All rights reserved
Subscribe to receive the latest news
Contact our team.

Sales Department

Crewed Department

Bareboat Department
- Sailing Yachts
- Motor Sailers
- Motor Yachts
- Our bareboat bases in Greece
- Yacht Management
- Technical Support / After-sales services
- Concierge services
Vernicos Yachts
Get in Touch
Sales Department: [email protected]
Crewed Department: [email protected]
Bareboat Department: [email protected]
Other: [email protected]
T : +30 210 9896 000
Ideas for you

BALI Catsmart

BAVARIA Cruiser 51

Private: FERRETTI 760

Lagoon 450F “ZACAPA”

LAGOON 42 “ALEXANDROS”

LAGOON 50 “VICTORIA”

BARACUDA VALLETTA

Bareboat yacht charter in Greece

Best beaches for Mykonos boat trips

Boats for sale in Greece

Bareboat Yachts

Bareboat Bases
or chat with an expert
Contact our charter team
Crewed Team

Send me a message

Built by the famous Dynamique Yachts shipyard, and having undergone a total refit in 2014, S/Y Amadeus was designed to please the most demanding of yachtsmen.
Built for smooth sailing, this elegant cutter rigged sloop has a sleek hull design, comfortably reaching top speeds of 12 knots and ensuring excellent sailing performance. Accommodation is offered for up to 12 guests in 5 spacious cabins (one master cabin, two identical double cabins with additional single bunks, two identical twin cabins) all with en suite facilities and audio/visual entertainment.

General Description
Carian Coast, Ionian Islands
Dynamique Yachts
1996 / 2018
Rates (MYBA Terms: + ALL)
45,500 € per week
35,000 € per week
2018 Nuvorania tender 4.60m Outboard EVINRUDE 75hp Splash pool Water Skis (adult and kids) Mono Ski Wakeboard
2 Tubes Inflatable Kayak Fishing Gear Snorkeling Equipment 4 Yoga mats

Destinations

Carian Coast
Superb historical sites set in magnificent scenery

Ionian Islands
Unforgettable Sailing Holidays
Request Availability
Get in touch for the yacht: AMADEUS
Download Brochure
Download brochure for the yacht
Add to Favourites
Keep track of your preferred yachts and access them quickly whenever you revisit our website.
AMADEUS Dynamique Yachts SA
- Inspiration
AMADEUS has 2 Photos

Amadeus News

Reduced charter rate offered by 44m ...
Similar yachts.

SHAMOUN | From US$ 65,100/wk
- Yachts >
- All Yachts >
- All Sail Boats Over 100ft/30m >
If you have any questions about the AMADEUS information page below please contact us .
A General Description of Sailing Yacht AMADEUS
AMADEUS was previously registered as project/yacht name Amadeus 1er. This 33 metre (109 ft) luxury yacht was built by Dynamique Yachts in 1991. Sailing Yacht AMADEUS is a well proportioned superyacht. The yacht is a modern sloop with a cutter rig. The naval architecture office whom authored the design work on this ship was Philippe Briand. Luxury yacht AMADEUS is a quality yacht that is able to accommodate as many as 12 guests on board and has a total of 5 crew members.
Sailing yacht AMADEUS was built by the famous Dynamique Yachts shipyard .The yacht features superb sailing characteristics which are complimented by her spacious interior and abundant deck space. Sailing sloop AMADEUS can accommodate 10 passengers in five cabins. With one large master stateroom and four additional cabins which are all air conditioned and have en suite bathrooms. She also has two separate salons and a full dining room. The aft deck is fully covered with seating. The fore deck has an unique pool on deck and swimming in the sea is made accessible by a large swim aft platform.
The Construction & Naval Architecture relating to Luxury Yacht AMADEUS
Philippe Briand was the naval architect firm involved in the formal nautical design work for AMADEUS. Also the company Philippe Briand skillfully collaborated on this undertaking. In 1991 she was actually launched to triumph in Marans and following sea trials and final completion was afterwards passed on to the yacht owner. Dynamique Yachts completed their new build sailing yacht in France. A reasonable proportion is brought about with a maximum beam (width) of 7.5 metres / 24.6 feet. With a 3.6m (11.8ft) draught (maximum depth) she is reasonably deep. The material composite was used in the building of the hull of the sailing yacht. Her superstructure above deck is built with the use of composite. Over the deck of AMADEUS she is 32.7 (107.3 ft) in length. In 2004 extra refitting and modernisation was also finished.
Engines & Speed For S/Y AMADEUS:
She is driven by twin screw propellers. The main engine of the ship gives 375 horse power (or 276 kilowatts). She is equiped with 2 engines. The combined thrust for the boat is therefore 750 HP / 552 KW.
On board Superyacht AMADEUS She has The Following Guest Accommodation Format:
Bestowing bedding for a maximum of 12 yacht guests sleeping aboard, the AMADEUS accommodates them in style. Normally the vessel requires approximately 5 professional crewmembers to run.
A List of the Specifications of the AMADEUS:
Further information on the yacht.
Condaria is the company that installed the A/C on the yacht. AMADEUS features a teak deck.
AMADEUS Disclaimer:
The luxury yacht AMADEUS displayed on this page is merely informational and she is not necessarily available for yacht charter or for sale, nor is she represented or marketed in anyway by CharterWorld. This web page and the superyacht information contained herein is not contractual. All yacht specifications and informations are displayed in good faith but CharterWorld does not warrant or assume any legal liability or responsibility for the current accuracy, completeness, validity, or usefulness of any superyacht information and/or images displayed. All boat information is subject to change without prior notice and may not be current.
Quick Enquiry
"Indeed we believe that the first function of a sailing yacht is the aesthetics and we spent a lot of time in refining the lines during the project." - "I understood very young that to win a race you have to have the best boat, and so I started to be interested about the technology and the design of the boat." - Philippe Briand

Yan Yelken | From EUR€ 28,980/wk

Seaquell | From US$ 40,000/wk

Shanti | From EUR€ 28,000/wk
- Yachts for sale
- Yachts for charter
- Brokerage News

- Yacht Harbour
- Yacht Amadeus
Contact agent, specifications, similar yachts.

New listings

- USA:-1.866.492.4768
- UK:-0800.011.2492
- How We Help Clients
- How to book a charter?
- Why Use Our Company
- Where our Charters Go
- Why Charter a Yacht
- Decades of Experience
- Meet our staff
- Contact us now
- Search charter yachts online
- What type of yacht should I charter?
- About Luxury Yacht Charter
- Charter a Mega Yacht
- Charter a Motor Yacht
- Charter a Crewed Catamaran
- Charter a Sailboat
- Yacht charter Blog
- About Caribbean Yacht Charters
- Virgin Islands
- Leeward Islands
- Windward Islands
- Yachts in the Caribbean
- About Bahamas Yacht Charters
- Bahamas weather
- Yachts in the Bahamas
- Western Mediterranean Yacht Charters
- Eastern Mediterranean Charters
- Browse Yachts in the Mediterranean
- South of France
- Spain, Mallorca, Ibiza
- Italy, Sicily, Naples & Amalfi
- Corsica and Sardinia
- Pacific Islands
- Sample Charter Itineraries
- Destinations Blog
- How to choose a yacht charter broker?
- How to book a yacht charter?
- What is special about yacht charter?
- What yacht charter costs are there ?
- Are there all inclusive charters?
- Why charter a yacht?
- What kinds of yacht can I charter?
- Where do yacht charters go?
- What defines luxury yacht charter?
- How to rent a yacht?
- How We Help
- 5 Common Yacht Charter Questions
- How to choose the right yacht?
- When is the best time to charter?
- All Yacht Charter Destinations
- What can you do on a yachting vacation?
- What to expect on a luxury charter?
- What contracts are used to book?
- Even more questions about chartering a yacht
- Crewed charter reviews
- Caribbean Reviews
- BVI Reviews
- Bahamas Reviews
- Mediterranean Reviews
- Email or Call Us

AMADEUS 110' Fully Crewed Sailing Yacht

- Summer Locations: Greece , Turkey Winter Locations: Greece
- Max Guests : 12 Cabins : 5 Crew : 6
- Starting at : EUR €39,500 (approx. $45,820 USD )
Charter rates do not include expenses or taxes
Her master cabin features a walk around king bed, desk/vanity, and en-suite bathroom. Additionally, there are two guest cabins each with a queen bed convertible to two twins, and two guest cabins each with a queen bed and twin bed. Each guest cabin has an en-suite.
Her main salon has a spacious, contoured conversational area, along with a large, flatscreen T.V. The aft deck features al fresco dining with Bimini top. Up on deck there are sun pads and a splash pool for you and your guests to enjoy.
Watersports offered include a 15 foot tender with 75hp engine, water skis for adults and children, tube, wakeboard, kayak, fishing gear, snorkeling gear, and rendezvous diving.
Additional Images

Does this yacht interest you?
Let us know a few details below, we'll check availability and answer all your questions:.
Even faster answer? Call Toll Free from USA/Canada: 1 866.492.4768 , Direct 1.954.448.5053
Send Message
Additional Sailing Yachts with 5 cabins:

LONG ISLAND 127' sailing yacht
Can sleep up to 10 guests in 5 staterooms Weekly rate starts at: EUR €45,500 (approx. $52,780 USD)
Summer Locations: Turkey
See additional pictures and info about LONG ISLAND » Contact us about LONG ISLAND »

TIGRA 124' sailing yacht
Can sleep up to 10 guests in 5 staterooms Weekly rate starts at: EUR €32,000 (approx. $37,120 USD)
Winter Locations: Greece , Turkey
Summer Locations: Greece , Turkey
See additional pictures and info about TIGRA » Contact us about TIGRA »

ALTHEA 122' sailing yacht
Can sleep up to 10 guests in 5 staterooms Weekly rate starts at: EUR €39,500 (approx. $45,820 USD)
Winter Locations: Greece
Summer Locations: Greece
See additional pictures and info about ALTHEA » Contact us about ALTHEA »

AMADEUS 110' sailing yacht
Can sleep up to 12 guests in 5 staterooms Weekly rate starts at: EUR €39,500 (approx. $45,820 USD)
See additional pictures and info about AMADEUS » Contact us about AMADEUS »
Yacht Name Search
Do you have a particular yacht in mind? We likely have it online and if not, email or call us for details. Search for it online by name here:
See Charter Yachts by region:
- Yachts in the Mediterranean
- Why you should choose us
Read more about charter yacht types:
- Mega Yachts
- Sailing yachts
International Yacht Charter Group Inc. does not guarantee the accuracy of any information or images displayed. Both are subject to change and may not be current. All information contained herein is not contractual. Continue reading for more details: 2003 - 2023 © All Rights Reserved. Privacy Policy Site map

Sailing Yacht | Amadeus

Fuel Capacity
Water capacity, sailing yacht amadeus | luxury crewed monohull.
Sailing yacht AMADEUS is a stunning 110 ft yacht available for charter in Greece. With a clean, spacious teak deck and a unique outdoor saloon that can seat up to 12 guests across two tables, it’s the perfect place for outdoor dining and entertainment. The deck saloon can also be enclosed with a special canopy and roll-up windows, making it suitable for use in all weather conditions. At the front of the boat, there’s a splash pool and sunbathing area with a removable awning for shade.
Inside the boat, a staircase from the cockpit leads to a well-lit and roomy saloon area with plenty of seating, including a formal dining area, bar, LCD TV, entertainment center, iPod dock station, and Playstation. Sailing Yacht AMADEUS can accommodate 10-12 guests in five large cabins, including a full-width master stateroom and two double cabins, each with an extra single bed. The two twin cabins can also be converted to doubles upon request, making her the only sailboat on the Greek market with five double beds.
To add to the fun, sailing yacht AMADEUS also comes with a range of water toys, including adult and children’s water skis, tubes, inflatable canoes, wakeboard, fishing rod, and snorkeling gear. She was built by Dynamique Yachts in 1996 and underwent a refit in 2014/2018.
ACCOMMODATION
- 1 Master cabin
- 2 VIP cabins
- 2 Twin cabins
Accomodation is offered for 10 -12 guests in 5 spacious cabins: Master cabin forward features a double bed, vanity unit and generous storage facilities, as well as audio/visual entertainment. The en-suite includess a large bath tub, shower and separate WC. Two identical double cabins with additional single bunks situated forward. Two identical double cabins situated aft which can be convertible to twins. (Total 5 double beds) All cabins with en suite facilities and audio/visual entertainment.
A professional crew of 5-6 members are accommodated in separate quarters.
Note that these specifications may vary slightly depending on the specific yacht’s configuration and modifications made by the owner.
New rigging BSI Denmark (2018) New North Sails (2016) Nuvorania tender 4.60m with a New Outboard EVINRUDE E tec 75hp Engines: 2 x 320HP Perkins Rolls Royce Generators: 1 Northern Lights x 25KW, 1 ONAN x 60KW Cruising speed: 10 Fuel consumption: 120 Litres/Hr Generators: 250 Liters/Day
Navigation and safety
- Outside GPS plotter
- Bow thruster
- Electric winches
- Classic mainsail
Saloon and cabins
- Air conditioning
- Coffee machine
- Kitchen utensils
- Pillows and blankets
Entertainment
- LCD 27″ TV, VCR, & CD entertainment systems in Saloon
- X-Box ONE X & Playstation 3 in Saloon
- Master cabin: TV, CD, & DVD entertainment systems
- Double cabins: TV, CD, & DVD entertainment systems
- Twin cabins (convertible to Doubles):TV, CD, & DVD entertainment systems
Water Sports
- Tender & Toys:
- 2018 Nuvorania tender 4.60m with a New Outboard EVINRUDE E tec75hp
- Water Skis (adult and kids)
- Inflatable Kayak
- Fishing Gear
- Snorkelling Equipment
- 4 Yoga mats
- Bathing platform
- Stand Up Paddle
Weekly price: €35,000 – €42,500
Low Season | High Season
Charter Type: Crewed
Berths: 10-12 guests, sailing area: argo-saronic, departure ports: alimos, athens, send us your request, personal information, booking information.
Odyssey Sailing is registered and bonded with the Greek National Tourist Organisation (GNTO – EOT) and is a member of the Hellenic Yacht Brokers Association (HYBA).
SOCIAL MEDIA
Useful links.
Antonopoulou 158D Volos, 38221, Greece
JOIN OUR NEWSLETTER
By subscribing to the Odyssey Sailing newsletter you agree to allow us collecting information about your open and click rates in order for us to develop further newsletter campaigns for our subscribers.

Length 33,5m / 109′ ft.
Built/Last Refit 2009/2021
Weekly rate Low € 35.000
Weekly rate High € 45.500
Accommodation
Luxury yacht AMADEUS can accommodate up to 12 guests in 5 cabins. One Master cabin with small desk and en suite facilities (wc separate from bath and shower). Two double cabins with additional single bed and two twin cabins. All cabins with en suite facilities.
Charter Amenities and Extras
S/Y AMADEUS has the following extras onboard: Tenders & Toys include Novourania tender 4.20m with YAMAHA X 70hp plus, MERCURY x 10hp, Water Skis, Mono Ski, Wakeboard, 2 Tubes, Fishing Gear, Snorkelling Equipment, Communications include VHF-GMDSS, Cellular phone, Radar, E-Mail/internet access, Audio Visual Equipment and Deck Facilities include Master cabin: TV, CD, & DVD entertainment system, Double cabins: TV, CD, & DVD entertainment system, Twin cabins: TV, CD, & DVD entertainment system, Saloon: LCD 27’ TV, VCR, & CD entertainment system.

Leave a comment Cancel reply
Save my name, email, and website in this browser for the next time I comment.
By using this form you agree with the storage and handling of your data by this website. *
This site uses functional cookies and external scripts to improve your experience.
Privacy settings
Privacy Settings
This site uses functional cookies and external scripts to improve your experience. Which cookies and scripts are used and how they impact your visit is specified on the left. You may change your settings at any time. Your choices will not impact your visit.
NOTE: These settings will only apply to the browser and device you are currently using.
Cookie Consent
This site uses cookies to offer you a better browsing experience. By using Hellas Yachting, you agree to our Privacy Policy, including cookie policy.

Discover more!
Sign up to receive inspiration on Yachting, the Mediterranean Lifestyle & Special Offers, the Valef way
*By completing this form you are signing up to receive our emails and can unsubscribe at any time

Charter the AMADEUS
AMADEUS is a 110-foot sailing yacht that can accommodate ten to twelve passengers in five staterooms as follows: a spacious Owner’s stateroom with a double bed, a vanity and an entertainment unit including TV, DVD and music system; two cabins with a double bed and an additional single bed; two cabins with two twin beds each. All staterooms have en suite bathrooms, a TV, DVD and CD player. There are two separate salons onboard as well as a full dining room. The aft deck is fully covered and has seating for all guests to dine in the open air. Forward of the cockpit is a lovely cushioned area for sunning and an unusual pool is found in the fore of the yacht. Swimming in the sea is made accessible by the large swim aft platform.
Image Gallery

Yacht Specifications:
Length: (33.26m/109.11ft), yacht type: sailing yachts, beam: 24.7 ft, built: 1996 | 2018, draft: 12.10 ft, builder: dynamic, guests: 10-12, engines: 2 x 320hp perkins rolls royce, generators: 1 northern lights x 25kw, 1 onan x 60kw, fuel: 120 ltrs/hr, configuration: 1 master cabin, 2 doubles cabins with a single bed each, 2 twin cabins, cruising speed: 10 knots/hr.
(*All specifications are given in good faith and offered for informational purposes only. Yacht inventory, specifications and charter rates are subject to change without prior notice.*)
Recreational Equipment
• NEW Novorania tender 4.60m with NEW EVINRUDE 75hp plus MERCURY x 10hp • Wakeboard • Water Skis (adult and kids), Mono Ski • 2 Tubes • Kayak • 4 Yoga mats • Fishing Gear Snorkelling Equipment
Weekly Rates
High season: €42,500/week, med season: €37,500/week, low season: €35,000/week.
(*Rates are given based on a week charter / Rates are subject to change without notice*)
Customer Reviews
I could no joke die tomorrow and be a happy man. ~ Matthew F.
Although we have traveled just about all over the world, this was probably our best vacation ever. We will be back! ~ Louise Z.
Our trip was FABULOUS! More than exceeded expectations. ~ Anne G.
We have just completed a vacation that I have thought about for a lot of years. Thank you all for making a dream come true!!!! ~ Mae & Bill M.
Everyone is still talking about the trip and I cannot imagine it going any better. ~ Jack D.
Interested in this yacht?
Let us create a custom tailored experience for you..
Country you Live In United States Canada Mexico United Kingdom Afghanistan Albania Algeria American Samoa Andorra Angola Anguilla Antigua and Barbuda Argentina Armenia Armenia Aruba Australia Austria Azerbaijan Azerbaijan Bahamas Bahrain Bangladesh Barbados Belarus Belgium Belize Benin Bermuda Bhutan Bolivia Bonaire Bosnia and Herzegovina Botswana Bouvet Island (Bouvetoya) Brazil British Indian Ocean Territory (Chagos Archipelago) British Virgin Islands Brunei Darussalam Bulgaria Burkina Faso Burundi Cambodia Cameroon Cape Verde Cayman Islands Central African Republic Chad Chile China Christmas Island Cocos (Keeling) Islands Colombia Comoros Congo Congo Cook Islands Costa Rica Cote d'Ivoire Croatia Cuba Curaçao Cyprus Cyprus Czech Republic Denmark Djibouti Dominica Dominican Republic Ecuador Egypt El Salvador Equatorial Guinea Eritrea Estonia Ethiopia Falkland Islands (Malvinas) Faroe Islands Fiji Finland France French Guiana French Polynesia French Southern Territories Gabon Gambia Georgia Georgia Germany Ghana Gibraltar Greece Greenland Grenada Guadeloupe Guam Guatemala Guernsey Guinea Guinea-Bissau Guyana Haiti Heard Island and McDonald Islands Holy See (Vatican City State) Honduras Hong Kong Hungary Iceland India Indonesia Iran Iraq Ireland Isle of Man Israel Italy Jamaica Japan Jersey Jordan Kazakhstan Kazakhstan Kenya Kiribati Korea Korea Kuwait Kyrgyz Republic Lao People's Democratic Republic Latvia Lebanon Lesotho Liberia Libyan Arab Jamahiriya Liechtenstein Lithuania Luxembourg Macao Macedonia Madagascar Malawi Malaysia Maldives Mali Malta Marshall Islands Martinique Mauritania Mauritius Mayotte Micronesia Moldova Monaco Mongolia Montenegro Montserrat Morocco Mozambique Myanmar Namibia Nauru Nepal Netherlands Netherlands Antilles New Caledonia New Zealand Nicaragua Niger Nigeria Niue Norfolk Island Northern Mariana Islands Norway Oman Pakistan Palau Palestinian Territory Panama Papua New Guinea Paraguay Peru Philippines Pitcairn Islands Poland Portugal Puerto Rico Qatar Reunion Romania Russian Federation Rwanda Saint Barthelemy Saint Helena Saint Kitts and Nevis Saint Lucia Saint Martin Saint Pierre and Miquelon Saint Vincent and the Grenadines Samoa San Marino Sao Tome and Principe Saudi Arabia Senegal Serbia Seychelles Sierra Leone Singapore Sint Maarten (Netherlands) Slovakia (Slovak Republic) Slovenia Solomon Islands Somalia South Africa South Georgia and the South Sandwich Islands Spain Sri Lanka Sudan Suriname Svalbard & Jan Mayen Islands Swaziland Sweden Switzerland Syrian Arab Republic Taiwan Tajikistan Tanzania Thailand Timor-Leste Togo Tokelau Tonga Trinidad and Tobago Tunisia Turkey Turkey Turkmenistan Turks and Caicos Islands Tuvalu U.S. Virgin Islands U.S. Minor Outlying Islands Uganda Ukraine United Arab Emirates Uruguay Uzbekistan Vanuatu Venezuela Vietnam Wallis and Futuna Western Sahara Yemen Zambia Zimbabwe
Destination Greece Turkey Montenegro and Croatia West Mediterranean
Number of Guests 1 2 - 4 4 - 6 6 - 8 8 - 10 10 - 12 12+
Number of Cabins 3 Cabin 4 Cabins 5 Cabins 6 Cabins 7 Cabins 8+ Cabins
Yacht Length 45ft - 70ft 70ft - 110ft 110ft - 130ft 130ft - 160ft 160ft +
Weekly Rate < €14,000 €14,000 - 35,000€ 35,000€ - 49,000€ 49,000€ - 70,000€ 70,000€ - 105,000€ 105,000€ - 175,000€ 175,000€ +
Write your Message
I want to receive news about Valef Yachts, yachts & charters and Mediterranean travel inspiration

Rent the Yacht, Own the feeling.

Call Us or fill the form
+90 216 900 28 62.
Don't hesitate to contact us!
Working time
Mon - Fri: 9:00 - 18:00 / Closed on Weekends
Company Headquarters
DEGIRMENDERE MAH. SANAYI CAD. 8 SK.7
KUSADASI 09400 AYDIN TURKIYE
Only for Carriers in the US , For loads, Please enter the required information.
Our offices.
Değirmendere Mah. Sanayi Cad.8
Sk. No:7 Kuşadası 09400 Aydın
+ (90) 256 340 03 40
[email protected]
Mon - Fri: 9:00 - 18:00 Closed on Weekends
Drive to us Now
Küçükbakkalköy Mah. Fevzipaşa Cad.
Bozkır Sok. No:1 ,K:3 D:15 Ataşehir 34750 Istanbul
+ (90) 216 900 28 62
+(90) 216 576 47 90
2, Stroitelny Lane, Elektrostal , Moscow
+7 (499) 390 35 04
Drive to our office
128 City Road , London EC1V 2NX
+44 20 4577 1271
Mon - Fri: 9:30 - 17:00 Closed on Weekends
26 Seaman Ave Hempstead 11550 New York
+1 646 980 28 04
Humberto 1 985,Piso 2,Ofic 222
Constitucion Capital Federal CP 1103
Buenos Aires
+54 11 52 371 371
Mon - Fri: 9:00 - 17:30 Closed on Weekends

Please use a modern browser to view this website. Some elements might not work as expected when using Internet Explorer.
- Landing Page
- Luxury Yacht Vacation Types
- Corporate Yacht Charter
- Tailor Made Vacations
- Luxury Exploration Vacations
- View All 3565
- Classic Yachts
- Catamaran Yachts
- Filter By Destination
- More Filters
- Latest Reviews
- Charter Special Offers
- Destination Guides
- Inspiration & Features
- Mediterranean Charter Yachts
- France Charter Yachts
- Italy Charter Yachts
- Croatia Charter Yachts
- Greece Charter Yachts
- Turkey Charter Yachts
- Bahamas Charter Yachts
- Caribbean Charter Yachts
- Australia Charter Yachts
- Thailand Charter Yachts
- Dubai Charter Yachts
- Destination News
- New To Fleet
- Charter Fleet Updates
- Special Offers
- Industry News
- Yacht Shows
- Corporate Charter
- Finding a Yacht Broker
- Charter Preferences
- Questions & Answers
- Add my yacht

View More Photos
- Luxury Charter Yachts
- Motor Yachts for Charter
- Amenities & Toys
- Rates & Regions
- + Shortlist
AMADEUS YACHT CHARTER
21.95m / 72' sunseeker 2008.
- Previous Yacht
Cabin Configuration
Special Features:
- Cruising speed of 22 knots
- Sleeps 6 guests
- Williams Jet RIB
Luxury yacht Amadeus is the perfect charter platform for yachting vacations spent entertaining in style
The 21.95m/72' motor yacht 'Amadeus' by the British shipyard Sunseeker offers flexible accommodation for up to 6 guests in 3 cabins.
If you're looking for a family-friendly yacht with plenty of onboard amenities, Amadeus is the perfect choice, promising superb charter vacations whatever the destination.
Guest Accommodation
Built in 2008, Amadeus offers guest accommodation for up to 6 guests in 3 suites comprising a master suite, one VIP cabin and one twin cabin. There are 4 beds in total, including 1 queen, 1 double and 2 singles. She is also capable of carrying up to 2 crew onboard to ensure a relaxed luxury yacht charter experience.
Onboard Comfort & Entertainment
Whatever your activities on your charter, you'll find some impressive features are seamlessly integrated to help you, notably Wi-Fi connectivity, allowing you to stay connected at all times, should you wish. Guests will experience complete comfort while chartering thanks to air conditioning.
Performance & Range
Powered by twin MAN engines, she comfortably cruises at 22 knots, reaches a maximum speed of 35 knots with a range of up to 250 nautical miles.
Onboard Amadeus has a range of toys and accessories to keep you and your guests entertained on the water throughout your stay. Principle among these are Super wid waterskis that are hugely entertaining whether you are a beginner or a seasoned pro. Another excellent feature are O' Brien Ace wakeboards so guests can show off at speed. When it's time to travel from land to see, it couldn't be easier with a Williams Jet RIB.
Motor yacht Amadeus boasts an impressive array of outstanding amenities for truly out-of-this-world charter vacations that you’ll never forget.
TESTIMONIALS
There are currently no testimonials for Amadeus, please provide .
Amadeus Photos

Amenities & Entertainment
For your relaxation and entertainment Amadeus has the following facilities, for more details please speak to your yacht charter broker.
Amadeus is reported to be available to Charter with the following recreation facilities:
- 1 x Williams 325 Jet RIB 100 HP engine
For a full list of all available amenities & entertainment facilities, or price to hire additional equipment please contact your broker.
- + shortlist
For a full list of all available amenities & entertainment facilities, or price to hire additional equipment please contact your broker.
'Amadeus' Charter Rates & Destinations
Please contact your charter broker for a quote or check availability .
Charter Amadeus
To charter this luxury yacht contact your charter broker , or we can help you.
To charter this luxury yacht contact your charter broker or
Update your yacht
Yacht Owner, Captain or Central Agents - Send us latest Photos, Charter Rates or Corrections Contact Us
SIMILAR YACHTS FOR CHARTER

d'Artagnan
20m | Ferretti Yachts
from $25,000 p/week ♦︎

21m | Azimut
from $27,000 p/week

21m | Ferretti Yachts
from $23,000 p/week ♦︎

21m | Aicon
from $17,000 p/week ♦︎

22m | Sunseeker
from $28,000 p/week ♦︎

20m | Galeon
from $13,000 p/week ♦︎

22m | Baia Yachts
from $29,000 p/week ♦︎

P'tite Bouille
21m | Princess
from $32,000 p/week ♦︎

Saint George
20m | Sunseeker
POA ♦︎

21m | President
from $24,000 p/week ♦︎
NOTE to U.S. Customs & Border Protection
Specification
- Share on Facebook
- Share Yacht
SIMILAR LUXURY CHARTER YACHTS
Here are a selection of yachts which are similar to the current charter yacht. To view all similar luxury charter yachts click on the button below.

As Featured In
The YachtCharterFleet Difference
YachtCharterFleet makes it easy to find the yacht charter vacation that is right for you. We combine thousands of yacht listings with local destination information, sample itineraries and experiences to deliver the world's most comprehensive yacht charter website.
San Francisco
- Like us on Facebook
- Follow us on Twitter
- Follow us on Instagram
- Find us on LinkedIn
- Add My Yacht
- Affiliates & Partners
Popular Destinations & Events
- St Tropez Yacht Charter
- Monaco Yacht Charter
- St Barts Yacht Charter
- Greece Yacht Charter
- Mykonos Yacht Charter
- Caribbean Yacht Charter
Featured Charter Yachts
- Maltese Falcon Yacht Charter
- Wheels Yacht Charter
- Victorious Yacht Charter
- Andrea Yacht Charter
- Titania Yacht Charter
- Ahpo Yacht Charter
Receive our latest offers, trends and stories direct to your inbox.
Please enter a valid e-mail.
Thanks for subscribing.
Search for Yachts, Destinations, Events, News... everything related to Luxury Yachts for Charter.
Yachts in your shortlist

Turn Your Curiosity Into Discovery
Latest facts.

3 TopRated Sites To Boost Your TikTok and Instagram Following

5 Detailed Facts About Medical Cannabis
40 facts about elektrostal.
Written by Lanette Mayes
Modified & Updated: 02 Mar 2024
Reviewed by Jessica Corbett

Elektrostal is a vibrant city located in the Moscow Oblast region of Russia. With a rich history, stunning architecture, and a thriving community, Elektrostal is a city that has much to offer. Whether you are a history buff, nature enthusiast, or simply curious about different cultures, Elektrostal is sure to captivate you.
This article will provide you with 40 fascinating facts about Elektrostal, giving you a better understanding of why this city is worth exploring. From its origins as an industrial hub to its modern-day charm, we will delve into the various aspects that make Elektrostal a unique and must-visit destination.
So, join us as we uncover the hidden treasures of Elektrostal and discover what makes this city a true gem in the heart of Russia.
Key Takeaways:
- Elektrostal, known as the “Motor City of Russia,” is a vibrant and growing city with a rich industrial history, offering diverse cultural experiences and a strong commitment to environmental sustainability.
- With its convenient location near Moscow, Elektrostal provides a picturesque landscape, vibrant nightlife, and a range of recreational activities, making it an ideal destination for residents and visitors alike.
Known as the “Motor City of Russia.”
Elektrostal, a city located in the Moscow Oblast region of Russia, earned the nickname “Motor City” due to its significant involvement in the automotive industry.
Home to the Elektrostal Metallurgical Plant.
Elektrostal is renowned for its metallurgical plant, which has been producing high-quality steel and alloys since its establishment in 1916.
Boasts a rich industrial heritage.
Elektrostal has a long history of industrial development, contributing to the growth and progress of the region.
Founded in 1916.
The city of Elektrostal was founded in 1916 as a result of the construction of the Elektrostal Metallurgical Plant.
Located approximately 50 kilometers east of Moscow.
Elektrostal is situated in close proximity to the Russian capital, making it easily accessible for both residents and visitors.
Known for its vibrant cultural scene.
Elektrostal is home to several cultural institutions, including museums, theaters, and art galleries that showcase the city’s rich artistic heritage.
A popular destination for nature lovers.
Surrounded by picturesque landscapes and forests, Elektrostal offers ample opportunities for outdoor activities such as hiking, camping, and birdwatching.
Hosts the annual Elektrostal City Day celebrations.
Every year, Elektrostal organizes festive events and activities to celebrate its founding, bringing together residents and visitors in a spirit of unity and joy.
Has a population of approximately 160,000 people.
Elektrostal is home to a diverse and vibrant community of around 160,000 residents, contributing to its dynamic atmosphere.
Boasts excellent education facilities.
The city is known for its well-established educational institutions, providing quality education to students of all ages.
A center for scientific research and innovation.
Elektrostal serves as an important hub for scientific research, particularly in the fields of metallurgy, materials science, and engineering.
Surrounded by picturesque lakes.
The city is blessed with numerous beautiful lakes, offering scenic views and recreational opportunities for locals and visitors alike.
Well-connected transportation system.
Elektrostal benefits from an efficient transportation network, including highways, railways, and public transportation options, ensuring convenient travel within and beyond the city.
Famous for its traditional Russian cuisine.
Food enthusiasts can indulge in authentic Russian dishes at numerous restaurants and cafes scattered throughout Elektrostal.
Home to notable architectural landmarks.
Elektrostal boasts impressive architecture, including the Church of the Transfiguration of the Lord and the Elektrostal Palace of Culture.
Offers a wide range of recreational facilities.
Residents and visitors can enjoy various recreational activities, such as sports complexes, swimming pools, and fitness centers, enhancing the overall quality of life.
Provides a high standard of healthcare.
Elektrostal is equipped with modern medical facilities, ensuring residents have access to quality healthcare services.
Home to the Elektrostal History Museum.
The Elektrostal History Museum showcases the city’s fascinating past through exhibitions and displays.
A hub for sports enthusiasts.
Elektrostal is passionate about sports, with numerous stadiums, arenas, and sports clubs offering opportunities for athletes and spectators.
Celebrates diverse cultural festivals.
Throughout the year, Elektrostal hosts a variety of cultural festivals, celebrating different ethnicities, traditions, and art forms.
Electric power played a significant role in its early development.
Elektrostal owes its name and initial growth to the establishment of electric power stations and the utilization of electricity in the industrial sector.
Boasts a thriving economy.
The city’s strong industrial base, coupled with its strategic location near Moscow, has contributed to Elektrostal’s prosperous economic status.
Houses the Elektrostal Drama Theater.
The Elektrostal Drama Theater is a cultural centerpiece, attracting theater enthusiasts from far and wide.
Popular destination for winter sports.
Elektrostal’s proximity to ski resorts and winter sport facilities makes it a favorite destination for skiing, snowboarding, and other winter activities.
Promotes environmental sustainability.
Elektrostal prioritizes environmental protection and sustainability, implementing initiatives to reduce pollution and preserve natural resources.
Home to renowned educational institutions.
Elektrostal is known for its prestigious schools and universities, offering a wide range of academic programs to students.
Committed to cultural preservation.
The city values its cultural heritage and takes active steps to preserve and promote traditional customs, crafts, and arts.
Hosts an annual International Film Festival.
The Elektrostal International Film Festival attracts filmmakers and cinema enthusiasts from around the world, showcasing a diverse range of films.
Encourages entrepreneurship and innovation.
Elektrostal supports aspiring entrepreneurs and fosters a culture of innovation, providing opportunities for startups and business development.
Offers a range of housing options.
Elektrostal provides diverse housing options, including apartments, houses, and residential complexes, catering to different lifestyles and budgets.
Home to notable sports teams.
Elektrostal is proud of its sports legacy, with several successful sports teams competing at regional and national levels.
Boasts a vibrant nightlife scene.
Residents and visitors can enjoy a lively nightlife in Elektrostal, with numerous bars, clubs, and entertainment venues.
Promotes cultural exchange and international relations.
Elektrostal actively engages in international partnerships, cultural exchanges, and diplomatic collaborations to foster global connections.
Surrounded by beautiful nature reserves.
Nearby nature reserves, such as the Barybino Forest and Luchinskoye Lake, offer opportunities for nature enthusiasts to explore and appreciate the region’s biodiversity.
Commemorates historical events.
The city pays tribute to significant historical events through memorials, monuments, and exhibitions, ensuring the preservation of collective memory.
Promotes sports and youth development.
Elektrostal invests in sports infrastructure and programs to encourage youth participation, health, and physical fitness.
Hosts annual cultural and artistic festivals.
Throughout the year, Elektrostal celebrates its cultural diversity through festivals dedicated to music, dance, art, and theater.
Provides a picturesque landscape for photography enthusiasts.
The city’s scenic beauty, architectural landmarks, and natural surroundings make it a paradise for photographers.
Connects to Moscow via a direct train line.
The convenient train connection between Elektrostal and Moscow makes commuting between the two cities effortless.
A city with a bright future.
Elektrostal continues to grow and develop, aiming to become a model city in terms of infrastructure, sustainability, and quality of life for its residents.
In conclusion, Elektrostal is a fascinating city with a rich history and a vibrant present. From its origins as a center of steel production to its modern-day status as a hub for education and industry, Elektrostal has plenty to offer both residents and visitors. With its beautiful parks, cultural attractions, and proximity to Moscow, there is no shortage of things to see and do in this dynamic city. Whether you’re interested in exploring its historical landmarks, enjoying outdoor activities, or immersing yourself in the local culture, Elektrostal has something for everyone. So, next time you find yourself in the Moscow region, don’t miss the opportunity to discover the hidden gems of Elektrostal.
Q: What is the population of Elektrostal?
A: As of the latest data, the population of Elektrostal is approximately XXXX.
Q: How far is Elektrostal from Moscow?
A: Elektrostal is located approximately XX kilometers away from Moscow.
Q: Are there any famous landmarks in Elektrostal?
A: Yes, Elektrostal is home to several notable landmarks, including XXXX and XXXX.
Q: What industries are prominent in Elektrostal?
A: Elektrostal is known for its steel production industry and is also a center for engineering and manufacturing.
Q: Are there any universities or educational institutions in Elektrostal?
A: Yes, Elektrostal is home to XXXX University and several other educational institutions.
Q: What are some popular outdoor activities in Elektrostal?
A: Elektrostal offers several outdoor activities, such as hiking, cycling, and picnicking in its beautiful parks.
Q: Is Elektrostal well-connected in terms of transportation?
A: Yes, Elektrostal has good transportation links, including trains and buses, making it easily accessible from nearby cities.
Q: Are there any annual events or festivals in Elektrostal?
A: Yes, Elektrostal hosts various events and festivals throughout the year, including XXXX and XXXX.
Was this page helpful?
Our commitment to delivering trustworthy and engaging content is at the heart of what we do. Each fact on our site is contributed by real users like you, bringing a wealth of diverse insights and information. To ensure the highest standards of accuracy and reliability, our dedicated editors meticulously review each submission. This process guarantees that the facts we share are not only fascinating but also credible. Trust in our commitment to quality and authenticity as you explore and learn with us.
Share this Fact:

Built by the famous Dynamique Yachts shipyard and having undergone a refit in 2018, sailing Yacht Amadeus was designed to please the most demanding of yachtsmen. Built for smooth sailing, this elegant cutter rigged sloop has a sleek hull design, comfortably reaching top speeds of 12 knots and ensuring excellent sailing performance. ...
The 33.5m/109'11" 'Amadeus' sail yacht built by the French shipyard Dynamiq is available for charter for up to 10 guests in 5 cabins. This yacht features interior styling by French designer Philippe Briand. Whether you are after the thrill of sailing or prefer to kick back, Amadeus is custom-built for adventure, offering a ring-side seat at the heart of the action once her sails have unfurled ...
Sailing yacht AMADEUS is a luxury vessel that measures 33.5m (109.9ft) in length. She was built by the famous Dynamique Yachts shipyard in 1995 and received a total refit in 2004 and smaller refits in 2012/14 and 2018 plus new interior fabrics in 2022. AMADEUS is an elegant cutter rigged sloop with a sleek hull design painted in an eye-catching ...
Amadeus Description. Built by the famous Dynamique Yachts shipyard, and having undergone a total refit in 2018, S/Y Amadeus was designed to please the most demanding of yachtsmen. Built for smooth sailing, this elegant cutter rigged sloop has a sleek hull design, comfortably reaching top speeds of 12 knots and ensuring excellent sailing ...
Length : 30.2 m / Passengers : 8. Special features : - One of the most elegant SW100- Excellent and experienced crew- Very elegant interiors- Available in West and East Med- Large outdoor spaceTender: 4.30... Price Per week from : 46 000€. View this yacht. AMADEUS is a fast cruising sailing yacht built by Dynamique Yachts and totally refit in ...
The 23.85m/78'3" sail yacht 'Amadeus' was built by Custom. Her interior is styled by design house Jean Marc Piaton and she was completed in 2018. Guest Accommodation. Amadeus has been designed to comfortably accommodate up to 8 guests in 4 suites. She is also capable of carrying up to 2 crew onboard to ensure a relaxed luxury yacht experience.
Built by the famous Dynamique Yachts shipyard, and having undergone a total refit in 2018. S/Y Amadeus was designed to please the most demanding of yachtsmen. Built for smooth sailing, this elegant cutter rigged sloop has a sleek hull design. Comfortably reaching top speeds of 12 knots and ensuring excellent sailing performance.
The yacht is maintained in excellent condition with a five-star crew year round. Sailing Yacht Amadeus was designed to please the most demanding of yachtsmen. Built for smooth sailing, this elegant cutter rigged sloop has a sleek hull design, comfortably reaching top speeds of 12 knots and ensuring excellent sailing performance.
AMADEUS I is a 44m/144' motor yacht for charter delivered by the Timmerman shipyard in 2014. Considered as a great luxury charter yacht for friends and family, AMADEUS I was fully upgraded in 2019. Her key features include a huge sundeck with a jacuzzi pool plus a brand-new beach club with a gym and sauna at sea level.
Built by the famous Dynamique Yachts shipyard, and having undergone a total refit in 2014, S/Y Amadeus was designed to please the most demanding of yachtsmen. Built for smooth sailing, this elegant cutter rigged sloop has a sleek hull design, comfortably reaching top speeds of 12 knots and ensuring excellent sailing performance.
AMADEUS was previously registered as project/yacht name Amadeus 1er. This 33 metre (109 ft) luxury yacht was built by Dynamique Yachts in 1991. Sailing Yacht AMADEUS is a well proportioned superyacht. The yacht is a modern sloop with a cutter rig. The naval architecture office whom authored the design work on this ship was Philippe Briand.
Amadeus is a 33.5 m sailing yacht. She was built by Dynamique Yachts in 1991. With a beam of 7.5 m and a draft of 3.9 m. The sailing yacht can accommodate 12 guests in 5 cabins. The yacht was designed by Philippe Briand.
Launched in 1996 by Dynamique Yachts, Amadeus is a 110 foot sailing sloop. To keep her up to date and comfortable for her guests, she has received refits in 2014 and 2018. She has been fitted with twin 320hp Perkins Rolls Royce engines for power, along with her sails.
33.5m / 109'11 Dragos Yachts 1996 / 2007. The 34.75m/114' 'Amadeus' motor yacht built by shipyard Dragos Yachts is available for charter for up to 12 guests in 5 cabins. This yacht features interior styling by Ugar Kose. Built in 1996, Amadeus's bespoke fittings and design ensure guests can explore the ocean's wonders in style and comfort.
Sailing Yacht AMADEUS can accommodate 10-12 guests in five large cabins, including a full-width master stateroom and two double cabins, each with an extra single bed. The two twin cabins can also be converted to doubles upon request, making her the only sailboat on the Greek market with five double beds.
Fully crewed Sailing Yacht AMADEUS available for private yacht charter in Greece, the best sailing holidays & vacation in the Greek Islands. +30 6948 295 207. [email protected] . Aten, Solonos 22-24, Agii Anargiri 135 61, Greece ... Sailing Yachts; Motor Sailer; Yacht Charter Terms; V.I.P. Services; Destinations; About us;
Charter theAMADEUS. AMADEUS is a 110-foot sailing yacht that can accommodate ten to twelve passengers in five staterooms as follows: a spacious Owner's stateroom with a double bed, a vanity and an entertainment unit including TV, DVD and music system; two cabins with a double bed and an additional single bed; two cabins with two twin beds each.
AMADEUS I is a 44m luxury motor super yacht available for charter built in 2014, refitted in 2019. Charter up to 10 guests in 5 cabins (1 Master, 2 VIP, 3 Double & 2 Twin) with a crew of 9. She is also available for events and corporate charter.
No:7 Kuşadası 09400 Aydın. + (90) 256 340 03 40. [email protected] . Mon - Fri: 9:00 - 18:00. Closed on Weekends. Istanbul Branch - Türkiye. Moscow - Russia. London - United Kingdom. New York - United States of America.
Küçükbakkalköy Mah. Fevzipaşa Cad. Bozkır Sok. No:1 ,K:3 D:15 Ataşehir 34750 Istanbul + (90) 216 900 28 62 +(90) 216 576 47 90. [email protected]
Get directions to Yuzhny prospekt, 6к1 and view details like the building's postal code, description, photos, and reviews on each business in the building
The 21.95m/72' 'Amadeus' motor yacht built by the British shipyard Sunseeker is available for charter for up to 6 guests in 3 cabins.. Primed for exploring secluded beaches and tucked-away lagoons or simply relaxing and soaking up the rays onboard, motor yacht Amadeus is tailor-made for family fun.
Known as the "Motor City of Russia." Elektrostal, a city located in the Moscow Oblast region of Russia, earned the nickname "Motor City" due to its significant involvement in the automotive industry.. Home to the Elektrostal Metallurgical Plant. Elektrostal is renowned for its metallurgical plant, which has been producing high-quality steel and alloys since its establishment in 1916.

IMAGES
COMMENTS
Ragnar was reborn as an explorer yacht in 2020. To accomplish his goal to go where few have gone before on private yachts, the owner chose to convert a commercial ship. His quest to find a Northern European shipyard that could realise his idea led him to Icon Yachts in Harlingen. Although established as a new yacht builder in 2005, Icon ...
The luxury yacht Ragnar was initially built in 2012 as an ice-breaking multipurpose supply vessel named Sanaborg.. In 2017 she was brought to Icon Yachts, who converted her into an explorer yacht.. Specifications. The superyacht is powered by 2 Caterpillar diesel engines, in combination with Wärtsilä diesel-electric pods.Her max speed is 12 knots. Her cruising speed is 10 kn
The Yacht Ragnar started out as an offshore supply vessel named Sanaborg for Wagenborg Shipping built in 2012 by Koninklijke Niestern Sander at their yard in Farmsum. Conversion. In 2017 Sanneborg was acquired by ICON Yachts as a starting point for the conversion to what later would become the yacht Ragnar after being laid up in 2015.
Luxury explorer yacht RAGNAR (previously Sanaborg) is a 68.2m (223.8ft) explorer and ice-breaker superyacht offers accommodation for up to 12 guests in 7 luxury cabins. She was converted from a Royal Niestern Sander support vessel into a luxury yacht by the Icon shipyard in the Netherlands and re-launched in 2019.
RAGNAR yacht interior With eight guest cabins for up to twelve guests, the RAGNAR yacht is a spacious yacht even with a further 17 crew members on board. She has two identical master suites kept in brown, dark blue, and golden tones creating a uniform design that can be found across the entire interior of the vessel.
The 28m/91'10" motor yacht 'Ragnar' was built by MCP Yachts in Brazil. Her interior is styled by design house MCP Yachts and she was completed in 2019. This luxury vessel's exterior design is the work of MCP Yachts. Guest Accommodation. Ragnar has been designed to comfortably accommodate up to 12 guests in 6 suites.
Ragnar is a custom motor yacht launched in 2012 by Royal Niestern Sander, in the Netherlands and most recently refitted in 2020. Ragnar measures 68.2 metres in length and has a beam of 14.3 feet. Her exterior design and interior design is by RWD. Ragnar also features naval architecture by Royal Niestern Sander.
RAGNAR. If you have any questions about the RAGNAR information page below please contact us. Built in 2018, 27.7m/90.9ft luxury yacht RAGNAR is the first of the 925 THD series from Brazilian shipyard MCP Yachts. The naval architecture and exterior styling is the work of the shipyard, who also worked in collaboration with Andreia Guiraldella and ...
The certified heli-deck allows for swift arrivals and departures on board, as well as offering the possibility for heli-skiing adventures or further exploration of the surrounding cruising grounds on board the Airbus EC145 helicopter. Take a look inside 68.2 metre explorer yacht Ragnar, now listed for sale with Arcon Yachts for €69,500,000.
After a 2-year conversion with Icon Yachts, the 68m/224ft explorer yacht RAGNAR has been given a new lease of life as a luxury charter yacht. RAGNAR made her first appearance on Friday, showing off her all-new look as she emerged from the shed at Icon's facilities in Harlingen. The yacht marks an exciting addition to the charter fleet.
The 68.2-metre Icon explorer yacht Ragnar has been sold by Konstantin Kolpakov of Arcon Yachts with Frank Grzeszczak Sr. of FGI Yacht Group representing the buyer.. Originally built as an ice-breaking multipurpose supply vessel in 2012, Ragnar was transformed into a world-girdling expedition yacht by Icon Yachts in Holland to a design by RWD and delivered in 2020.
M/Y Ragnar is a 68.2m Icon Yachts luxury superyacht available for charter. With a total of 8 cabins (6 double, 1 double/twin, 1 twin, 1 Pullman), she can charter up to 12 guests with a crew of 16. ... RAGNAR grants the willing the ability to fly with eagles, to dive with whales, to carve through the waves with the power of 800 horses and to ...
2012/2020. Project Ragnar is a large-scale conversion project of 62.8-meter icebreaker Sanaborg into a luxury explorer. All the works of two-year project were carried out under the technical control of Arcon Yachts at the Dutch shipyard ICON Yachts, which also made a refit of the famous explorer Legend, as well converted from a support vessel ...
Q(ex. Ragnar) is a 68.2 m explorer motor yacht. She was built by Koninklijke Niestern Sander in 2012. She is powered by Caterpillar engines of 2682 hp each giving her a maximum speed of 10 knots. The motor yacht can accommodate 12 guests in 6 cabins.
Design Philosophy Ragnar. In 2017 our Research and Consultancy department was assigned with the conversion design study for the ice breaking multipurpose support vessel Sanaborg (also originally designed by Conoship International) to the unique explorer superyacht "Ragnar". Based on the owners and Icon Yachts' wishes and demands we provided a technical general arrangement plan together ...
Ragnar - 2020 ICON YACHTS 223' 10" CONTACT Similar Listings For Sale New Search. Ragnar is a 223' 10" (68.2m) Expedition or Explorer Motor Yacht built by ICON YACHTS and delivered in 2020. Photos and specifications available below. Find yachts and boats listed for sale and ones off the market in our YATCO Yacht & Boat Directory. This web page ...
Inspired by the identity of the famous Norse warrior king, the 68.2-metre charter yacht Ragnar was built to take guests out of their comfort zones and into an unchartered world of snowy mountain tops, unforgiving tundra and pitch-black ocean depths that teams with marine life. Beneath her rugged exterior is an even more untamed commercial backbone that sets motor yacht Ragnar apart from luxury ...
Following the construction of Icon's remarkable 68 meter explorer yacht "Ragnar" has been a unique and thrilling privilege, and one I am so happy to have bee...
The 68.2m/223'9" expedition yacht 'Q' by shipyard Royal Niestern Sander offers flexible accommodation for up to 12 guests in 8 cabins and features interior styling by British designer RWD. She originally served as an ice breaking multipurpose support supply vessel before being converted into a yacht by Icon Yachts in 2020.
Impressions; At 91 meters in length, Lady Lara is an ultramodern superyacht with sweeping curves and an elegantly balanced profile. Dynamic, sculpted features carry through her ex
In 1938, it was granted town status. [citation needed]Administrative and municipal status. Within the framework of administrative divisions, it is incorporated as Elektrostal City Under Oblast Jurisdiction—an administrative unit with the status equal to that of the districts. As a municipal division, Elektrostal City Under Oblast Jurisdiction is incorporated as Elektrostal Urban Okrug.
Apr 24, 2018. Hanse's E-motion electric rudder drive represents a true breakthrough in auxiliary propulsion for saiboats. When news that Hanse Yachts had launched a new form of electric-powered yacht first broke in the winter of 2016, it was widely reported. After all, Hanse is one of the world's biggest builders of sailing boats, so this .....
Built by the famous Dynamique Yachts shipyard and having undergone a refit in 2018, sailing Yacht Amadeus was designed to please the most demanding of yachtsmen. Built for smooth sailing, this elegant cutter rigged sloop has a sleek hull design, comfortably reaching top speeds of 12 knots and ensuring excellent sailing performance. ..... The 33.5m/109'11" 'Amadeus' sail yacht built by the ...